 English
  Русский
 Bahasa Indonesia
 Bahasa Malay
 ไทย
ไทย Español
 Deutsch
 Български
 Français
 Tiếng Việt
 中文
中文 বাংলা
বাংলা हिन्दी
 Čeština
 Українська
 Română

EUR/USD
Higher Timeframes
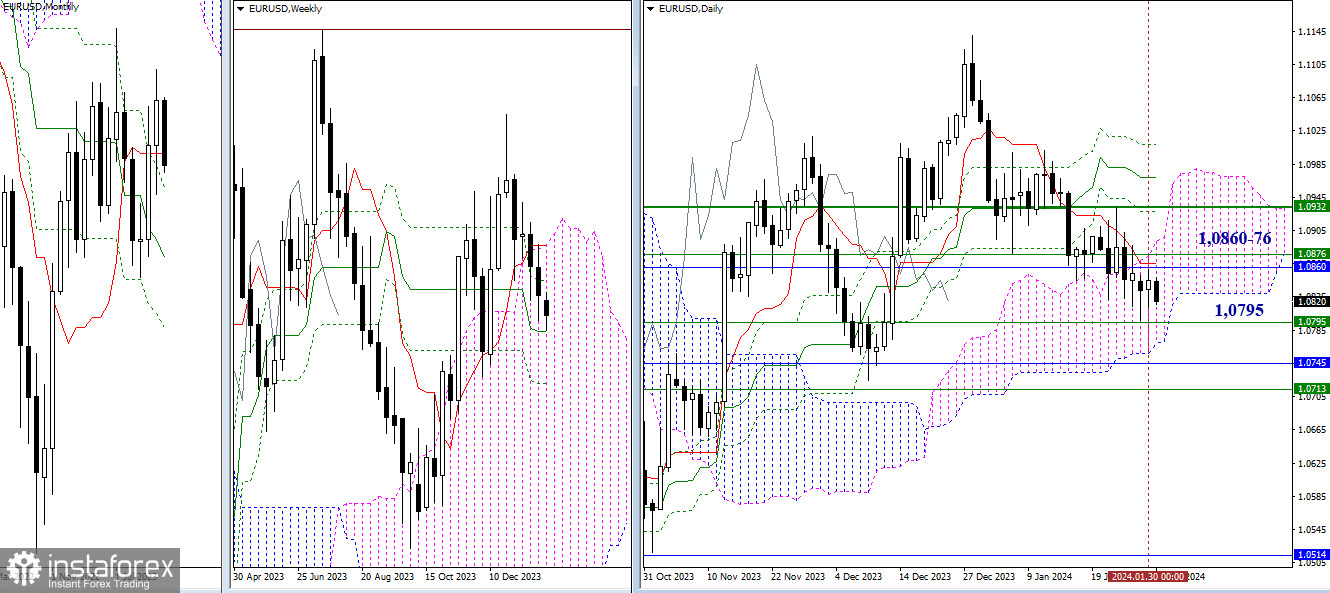
The pair continues to trade within the resistance range of 1.0860 – 1.0876, where several levels of different timeframes converge. In the event of a sustained move above this range, bullish players may formulate new plans, such as a return to the bullish zone relative to the weekly cloud (1.0932) and the elimination of the death cross of the daily Ichimoku cloud (1.0928 – 1.0969 – 1.1009). If, however, bearish players demonstrate activity and effectiveness, then after breaking through the support of the weekly medium-term trend (1.0795), they will need to exit the daily cloud (1.0769) and attempt to break beyond the limits of the weekly (1.0713) and monthly (1.0747) Fibonacci Kijun levels.
H4 – H1
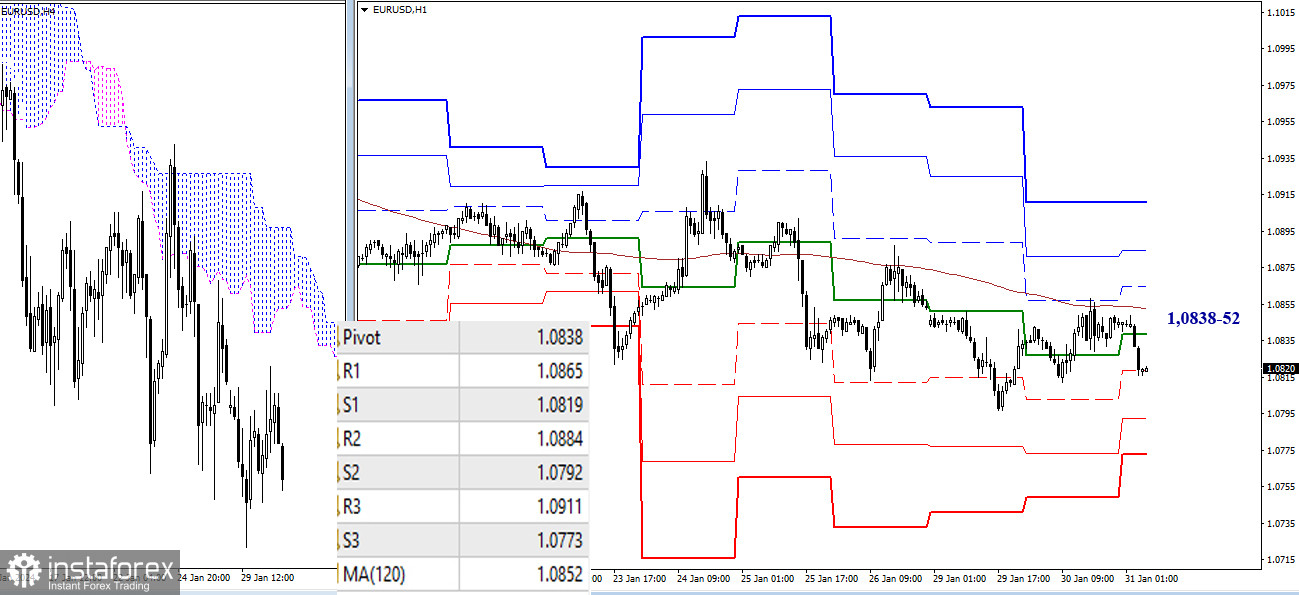
Yesterday, the weekly long-term trend on lower timeframes successfully defended the interests of bearish players. To further restore their positions, the bears must update the low (1.0797) today. In the development of a downward trend within the day, the support levels of the classic pivot point (1.0792 – 1.0773) may come into play. If the market returns to the idea of breaking key levels, currently located at 1.0838-52 (central pivot point of the day + weekly long-term trend), a reliable consolidation above and a reversal of the moving average will open up new prospects for bullish players. Further targets for the upward movement can be marked at 1.0865 – 1.0884 – 1.0911 (resistances of classic pivot points).
***
GBP/USD
Higher Timeframes
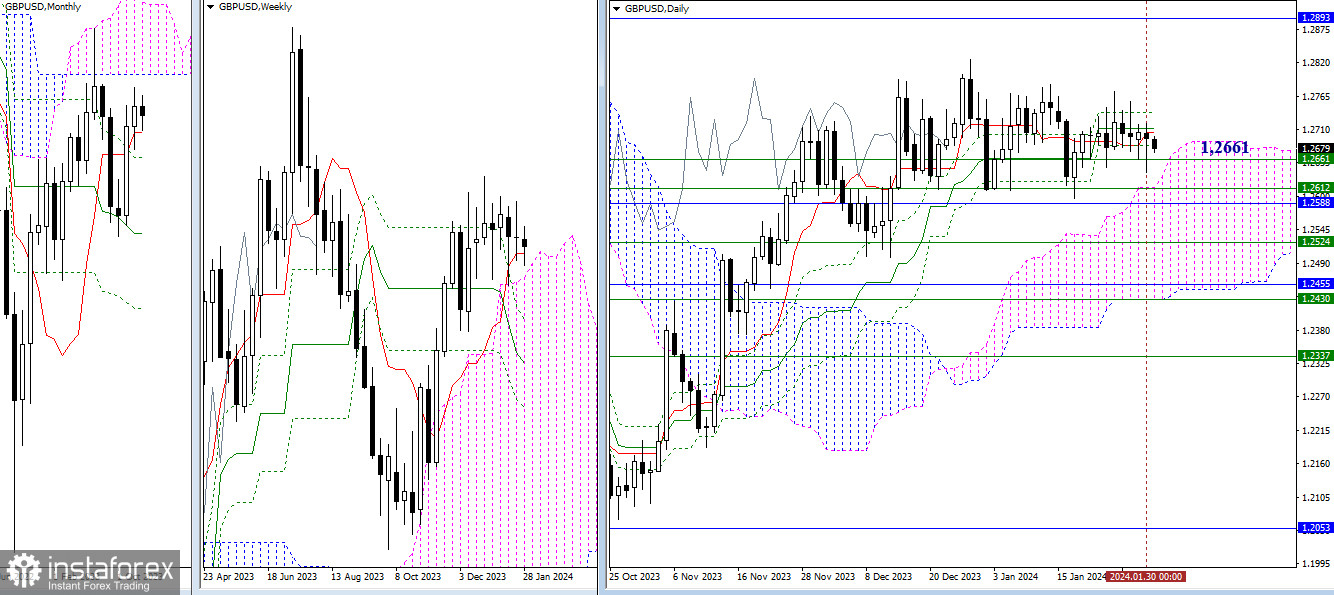
Yesterday's test of the weekly short-term trend (1.2661) ended again with a long lower shadow of the daily candle. The market is not ready to break this support yet. Nevertheless, tension in the consolidation is increasing, and things can change quickly. A break of 1.2661 will send players towards various support levels on different timeframes, with the nearest ones waiting at 1.2612 – 1.2588 (monthly short-term trend + upper boundary of the weekly cloud). On the other hand, a rebound from 1.2661 should free the pair from the attraction of Ichimoku's daily cross levels (1.2684 – 1.2711 – 1.2738), after which attention will be focused on the recovery of the upward trend (1.2826) and progress towards the monthly Ichimoku cloud (1.2893).
H4 – H1
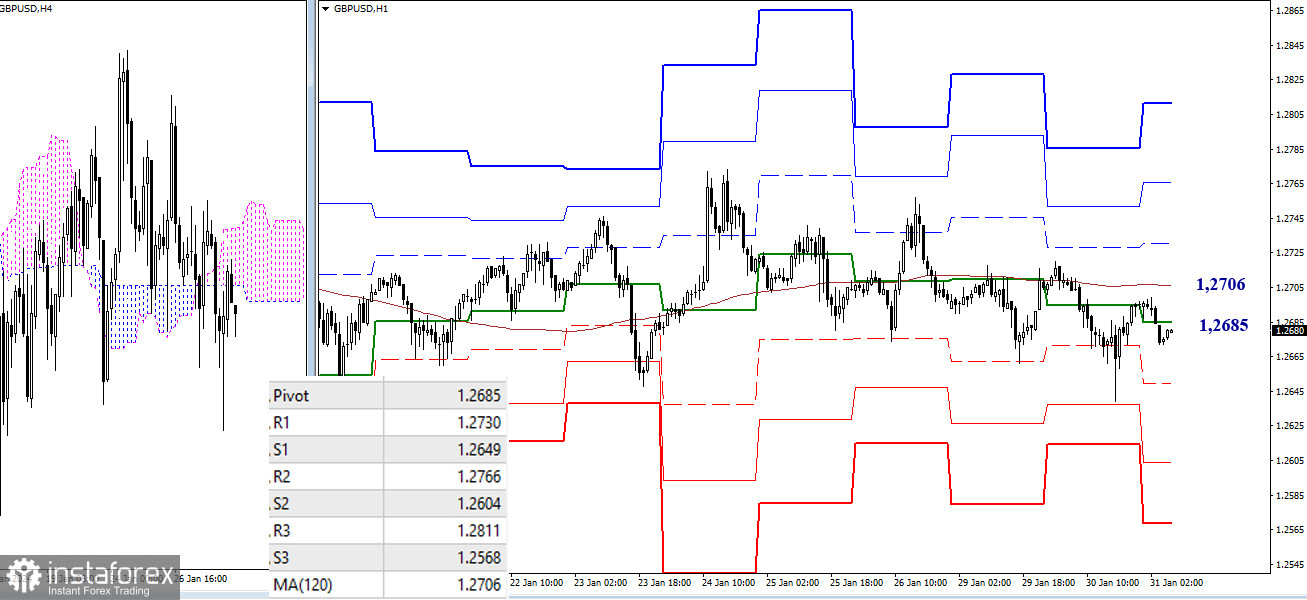
On lower timeframes, bearish players maintain an advantage, but they struggle to develop a downward trend. Instead, they repeatedly return to testing key levels. Today, these key levels are at 1.2685 (central pivot point) and 1.2706 (weekly long-term trend). A breakthrough and a reliable consolidation above these levels can change the current balance of power. Additional targets for intraday movement are provided by classic pivot points, currently located at 1.2649 – 1.2604 – 1.2568 (supports) and 1.2730 – 1.2766 – 1.2811 (resistances).
***
The technical analysis of the situation uses:
Higher timeframes - Ichimoku Kinko Hyo (9.26.52) + Fibonacci Kijun levels
Lower timeframes - H1 - Pivot Points (classic) + Moving Average 120 (weekly long-term trend)