 English
  Русский
 Bahasa Indonesia
 Bahasa Malay
 ไทย
ไทย Español
 Deutsch
 Български
 Français
 Tiếng Việt
 中文
中文 বাংলা
বাংলা हिन्दी
 Čeština
 Українська
 Română

Analysis of EUR/USD 5M
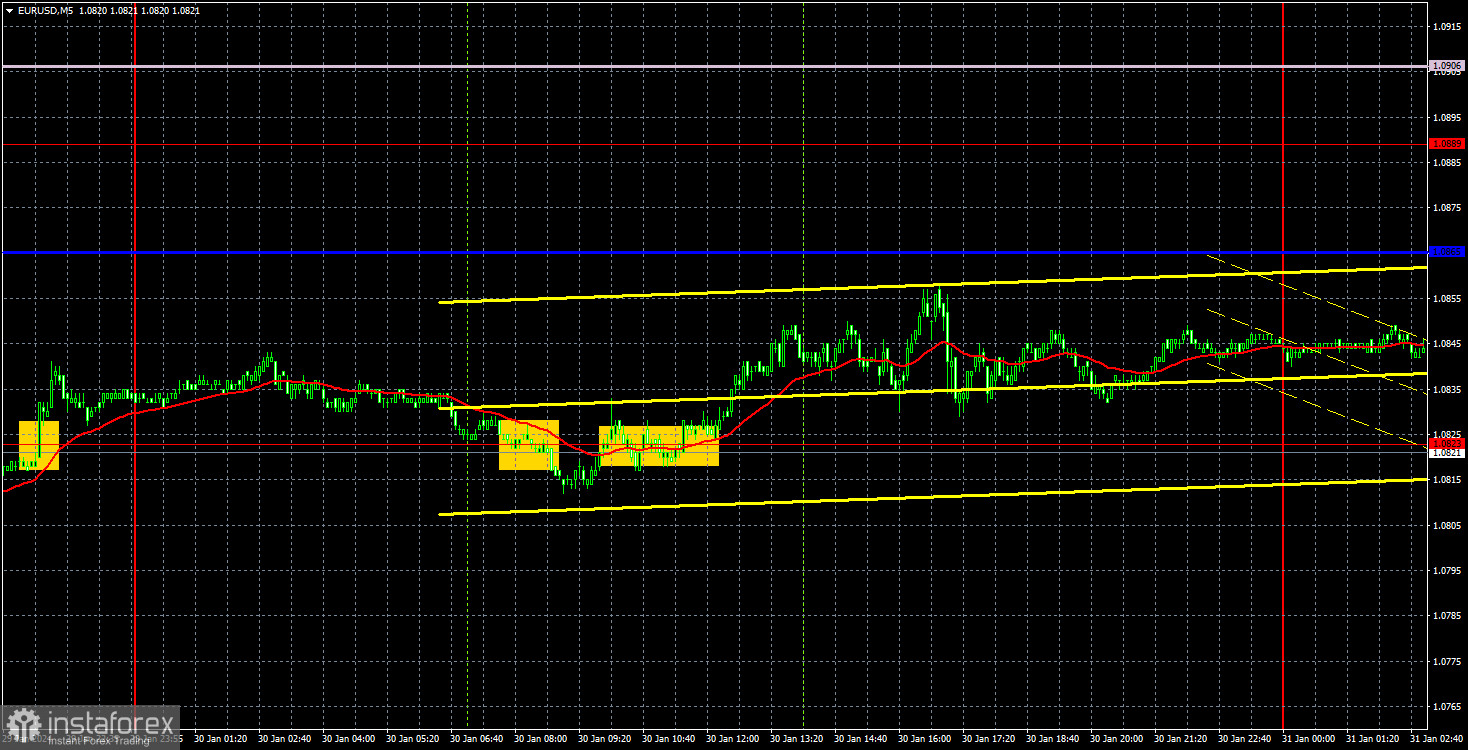
On Tuesday, EUR/USD once again showed very weak movements with a bearish bias. The best way to describe it is "the price is gradually sliding down." We said that it is "sliding" because volatility remains weak. The market seems to be unsure of its actions or is openly waiting for something. So how can these events affect the euro and the dollar?
On Tuesday, the price once again broke through the level of 1.0823, but we did not see a pronounced decline. The flat phase seems to have ended, but what does it matter if the price's decline isn't enough? Therefore, we can say the following. The downtrend undoubtedly persists, but one needs to be in the trade for at least a few days before they expect to make a profit.
Yesterday, GDP reports for Germany and the eurozone were released. They had no significant impact on the pair's movement. Traders reacted to the reports but it wasn't anything noteworthy. Both reports showed very weak values. In the United States, the JOLTs report on the number of job vacancies was published, which supported the dollar, as it exceeded forecast values. However, the dollar's rise was weak and short-lived.
There were few trading signals on Tuesday. The first sell signal turned out to be a false signal, as the price failed to breach the level of 1.0823. Then a stronger buy signal followed near the same level, and traders could earn about 10-15 pips. The volatility of the day was only 46 pips, so such a profit looks decent.
COT report:
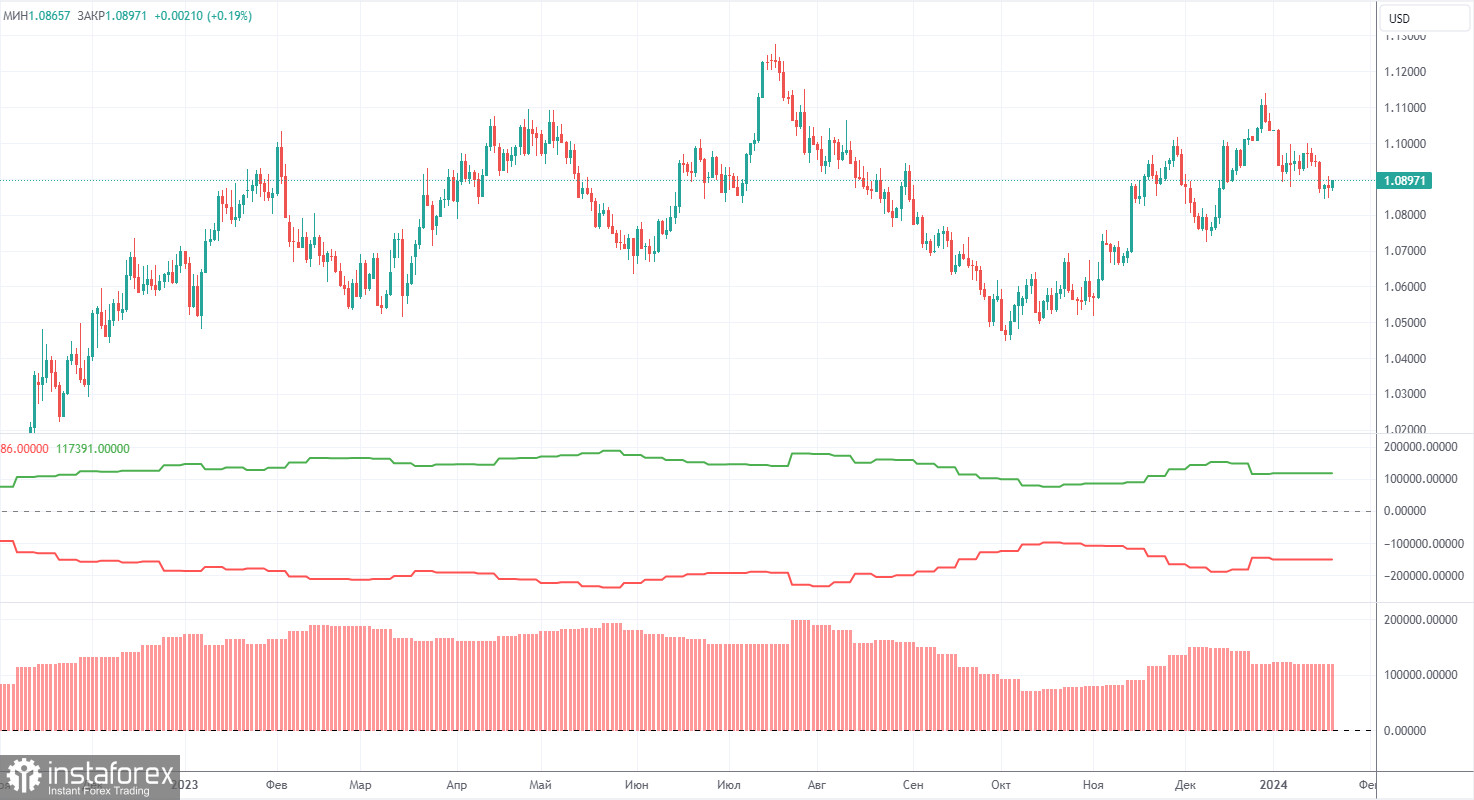
The latest COT report is dated January 23. As seen in the charts above, it is clear that the net position of non-commercial traders has been bullish for quite some time. To put it simply, the number of long positions is much higher than the number of short positions. This should support the euro, but we still do not see fundamental factors for the euro to strengthen further. In recent months, both the euro and the net position have been rising. However, over the past few weeks, big players have started to reduce their long positions, and we believe that this process will continue.
We have previously pointed out that the red and green lines have moved apart from each other, which often precedes the end of a trend. At the moment, these lines are still far apart. Therefore, we support the scenario in which the euro should fall and the uptrend must end. During the last reporting week, the number of long positions for the non-commercial group decreased by 9,100, while the number of short positions increased by 6,600. Accordingly, the net position fell by 15,700. The number of buy contracts is still higher than the number of sell contracts among non-commercial traders by 89,000 (it was 104,000). The gap is quite large, and even without COT reports, it is clear that the euro should continue to fall.
Analysis of EUR/USD 1H
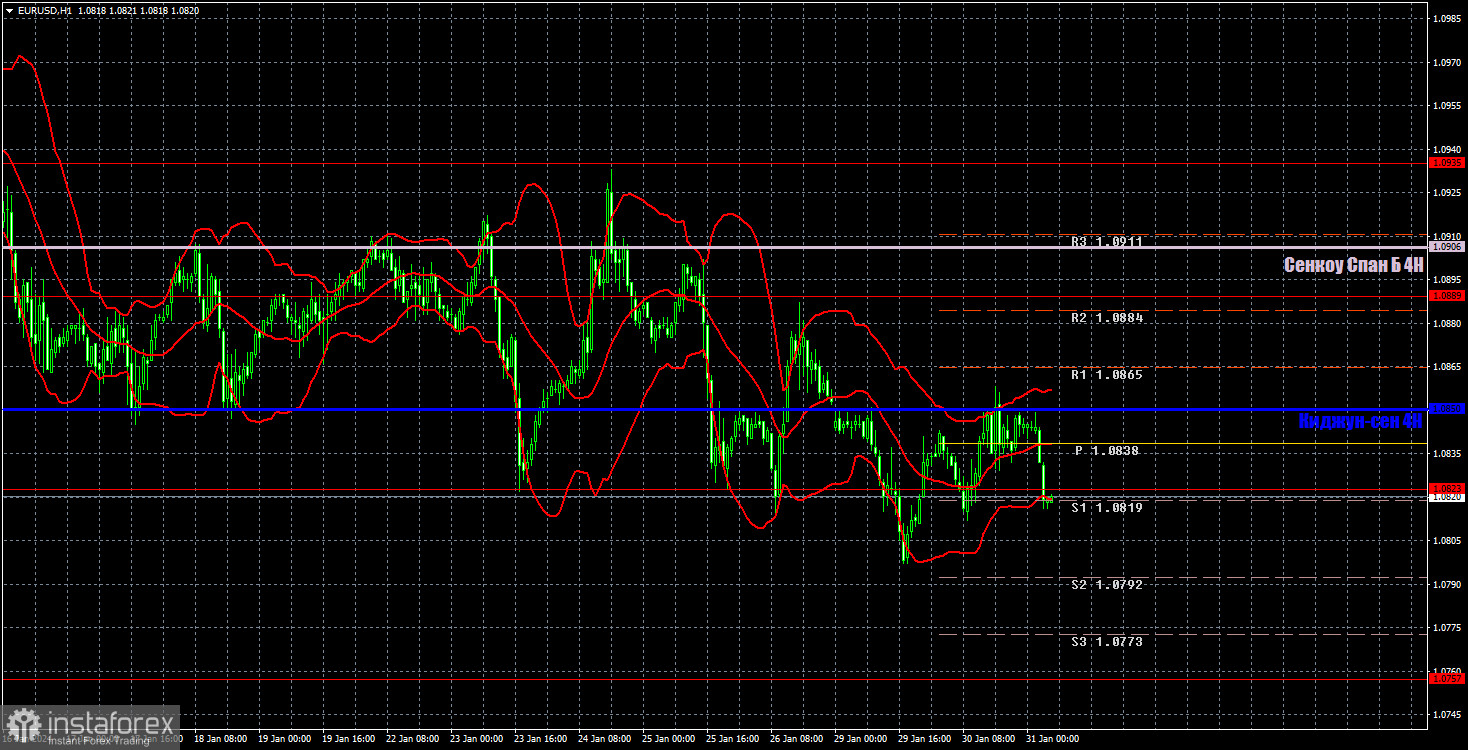
On the 1-hour chart, EUR/USD has already breached the level of 1.0823 three times, so we can expect the downtrend to resume after two weeks of a flat phase. The price is below the Kijun-sen and Senkou Span B lines. However, this week, we can look forward to a lot of important reports and events, so you should be cautious when opening any trades.
Today, we believe that the price will continue to "draw fences" with a small downward slope. We will consider new short positions with 1.0757 as the target if the price bounces again from the critical line or confidently breaches the level of 1.0823. You may consider longs if the price consolidates above the Kijun-sen with Senkou Span B as the target.
On January 31, we highlight the following levels for trading: 1.0658-1.0669, 1.0757, 1.0823, 1,0889, 1.0935, 1.1006, 1.1092, 1.1137, 1.1185, 1.1234, 1.1274, as well as the Senkou Span B line (1.0906) and Kijun-sen (1.0850) lines. The Ichimoku indicator lines can move during the day, so this should be taken into account when identifying trading signals. Don't forget to set a breakeven Stop Loss if the price has moved in the intended direction by 15 pips. This will protect you against potential losses if the signal turns out to be false.
On Wednesday, inflation, unemployment, and retail sales reports will be published in Germany, but the market is already focused on the Federal Reserve meeting, the results of which will be announced in the evening.
Description of the chart:
Support and resistance levels are thick red lines near which the trend may end. They do not provide trading signals;
The Kijun-sen and Senkou Span B lines are the lines of the Ichimoku indicator, plotted to the 1H timeframe from the 4H one. They provide trading signals;
Extreme levels are thin red lines from which the price bounced earlier. They provide trading signals;
Yellow lines are trend lines, trend channels, and any other technical patterns;
Indicator 1 on the COT charts is the net position size for each category of traders;
Indicator 2 on the COT charts is the net position size for the Non-commercial group.