 English
  Русский
 Bahasa Indonesia
 Bahasa Malay
 ไทย
ไทย Español
 Deutsch
 Български
 Français
 Tiếng Việt
 中文
中文 বাংলা
বাংলা हिन्दी
 Čeština
 Українська
 Română

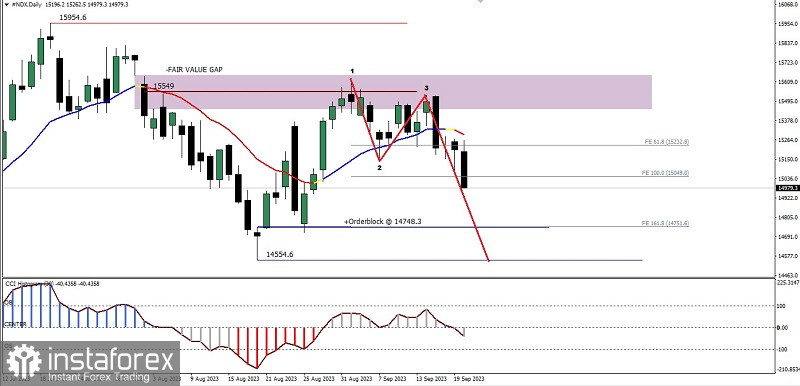
With the CCI indicator successfully breaking below three important levels (100, 0, & -100) on its daily chart and the price movement being below the WMA (20), and the emergence of the Bearish 123 pattern which coincidentally intersects within the Bearish Fair Value Gap area level, then, in the next few days, as long as there is no upward correction past level 15640.6, #NDX will have the opportunity to continue its decline to level 14748.3 as its main target and level 14554.6 as its second target.
(Disclaimer)