 English
  Русский
 Bahasa Indonesia
 Bahasa Malay
 ไทย
ไทย Español
 Deutsch
 Български
 Français
 Tiếng Việt
 中文
中文 বাংলা
বাংলা हिन्दी
 Čeština
 Українська
 Română

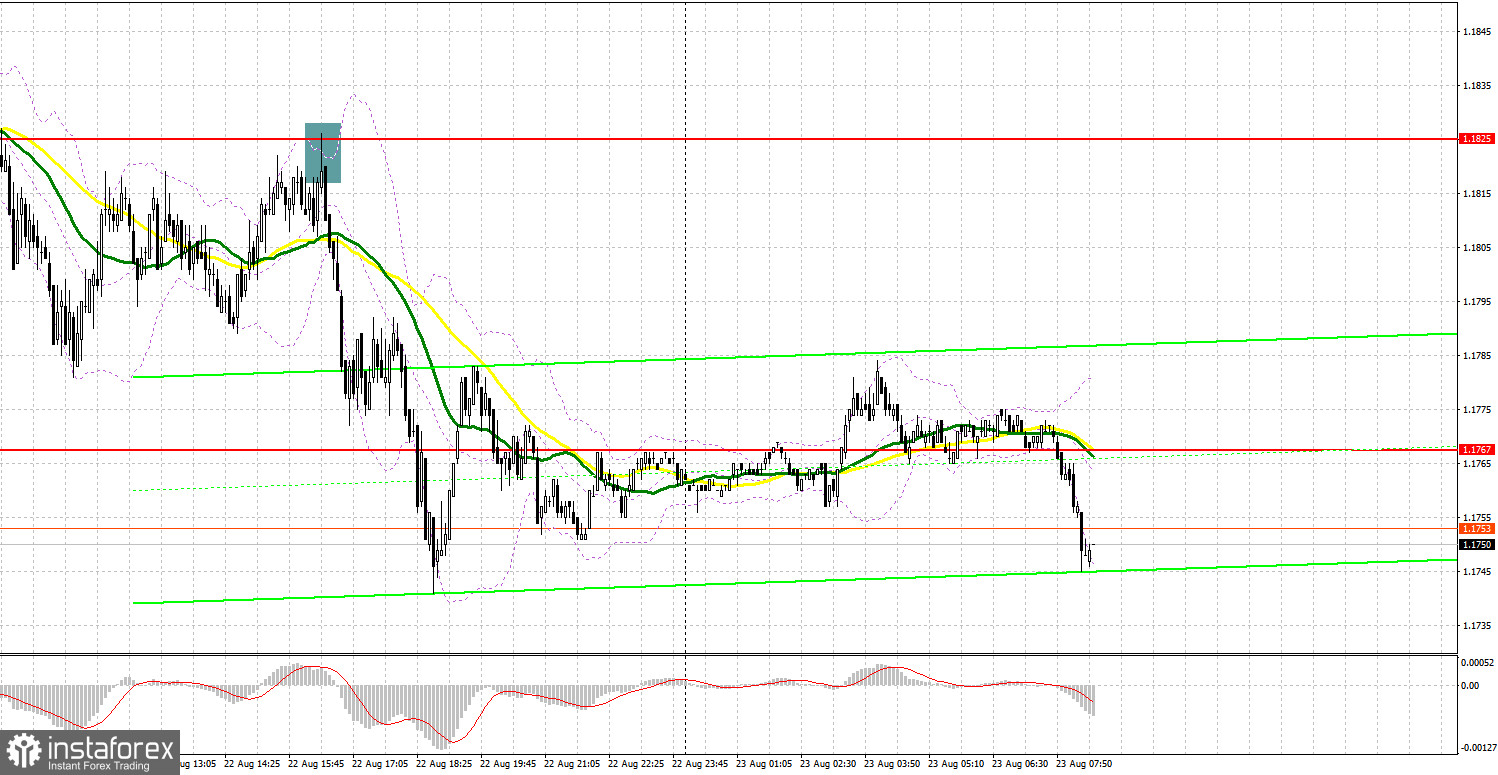
Yesterday, several signals were formed to enter the market. Let's take a look at the 5-minute chart to clear up the situation. In my morning forecast, I mentioned the level of 1.1806 and recommended entering the market from there. A false breakout of the 1.1806 area at the very beginning of the day generated a signal to buy the pound. Unfortunately, it was never activated as there was no movement to the upside. Then the pair continued to trade around 1.1806 which completely canceled the pair's upward potential for the start of the week. In the afternoon, bulls tried to return the price above 1.1825 but all they could do was a false breakout and a signal to sell the pound in line with the trend. As a result, the pair dropped by more than 80 pips.
For long positions on GBP/USD:
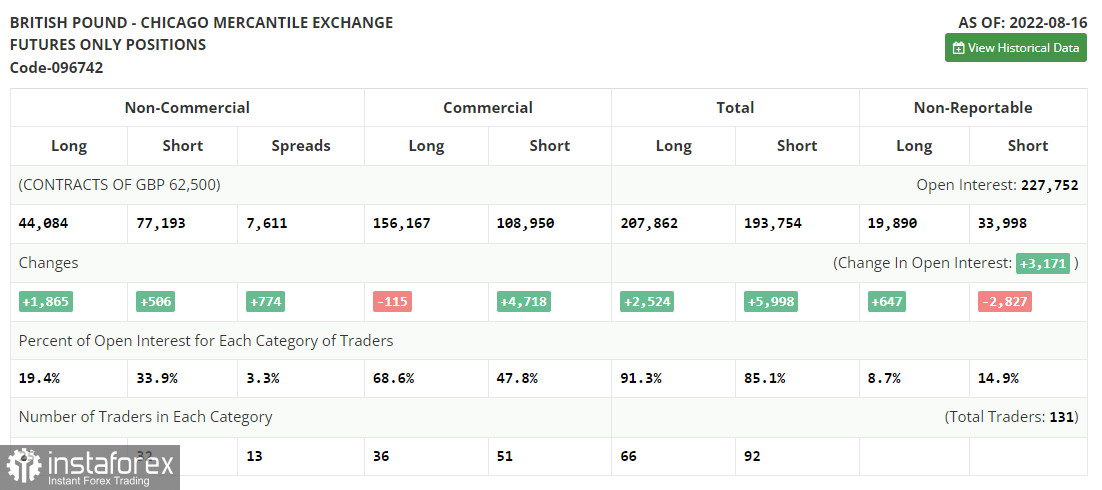
Before proceeding with technical analysis, let's first analyze the situation in the futures market. The COT (Commitment of Traders) report for August 16 recorded an increase in both short and long positions. Yet, these changes no longer reflect the real state of the market. Strong pressure on the pair that started in the middle of last week still persists. Naturally, the number of those who would like to buy the pound in the current macroeconomic conditions will gradually reduce. Markets are looking ahead to the Jackson Hole economic symposium. This event may boost the US dollar and push it even higher against the pound. This scenario will come true if Fed Chair Jerome Powell confirms the hawkish stance of the regulator regarding aggressive monetary tightening that aims to tame inflation. The latest COT report showed that long positions of the non-commercial group of traders rose by 1,865 to 44,084, while short positions went up by 506 to 77,193. This led to a decrease in the negative non-commercial net position to -33,109 from -34,468. The weekly closing price has slightly changed to 1.2096 against 1.2078.
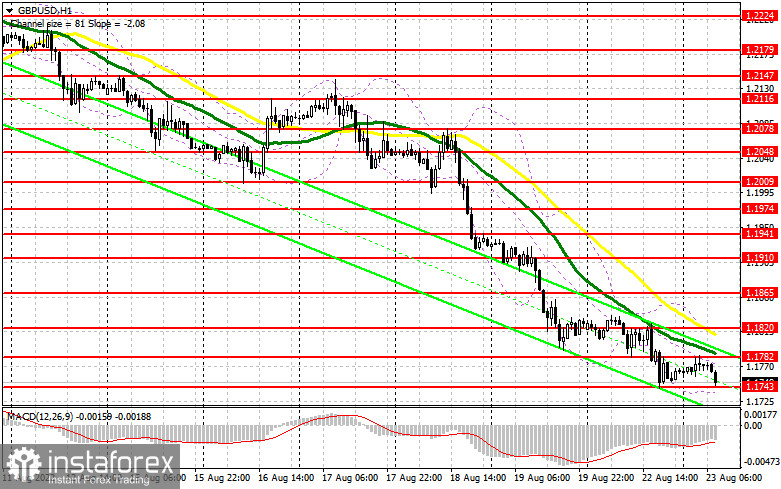
Today, several important macroeconomic reports will be published in the UK. In particular, the manufacturing and services PMI will be released along with the data on the composite PMI index. Most likely, these indicators will show a decline, so we cannot count on them. If GBP/USD continues to fall in the first half of the day, it is recommended to buy the pair after a false breakout of the nearest support at 1.1743. The pair tested this level yesterday. This may result in an upside pullback and a jump to the 1.1782 area where the moving averages support the bearish trend. A rise above 1.1782 will open the door for an upward correction. A breakout and a downward retest of the 1.1782 level will pave the way to 1.1820. The area of 1.1865 will serve as a more distant target where I recommend profit taking. If GBP/USD declines and bulls don't open any positions at 1.1743, the pressure on the pound will increase which will force the bulls to leave the market. If so, it is better to open long positions only when the quote reaches the key support of 1.1707. After that, the price may head for new yearly lows. I recommend going long on the pair only after a false breakout. You can open buy positions on GBP/USD immediately on a rebound from 1.1643, or even lower from 1.1573, bearing in mind a possible intraday correction of 30-35 pips.
For short positions on GBP/USD:
Today, the fight for the nearest resistance of 1.1782 will be the main goal for bears. The moving averages supporting the bearish trend are also located at this level. The downbeat data on UK PMI along with the negative data on the Confederation of British Industry's order book balance will help the sellers to stay in control. If reports are positive and the pair moves up, only a false breakout of the 1.1782 level will return pressure on the pound. If so, a sell signal will be formed with the downward target found at the support of 1.1743. A breakout and an upside retest of this range will create an entry point to sell GBP with the next target located at 1.1707. The next downward target is found in the area of 1.1643 where I recommend profit taking. If GBP/USD rises and bears don't open any positions at 1.1782, buyers will have an excellent opportunity to return the price to 1.1820, which will make things difficult for pound sellers. Only a false breakout around 1.1820 will form an entry point for going short with a prospect of a further decline. If nothing happens there as well, the price may surge to the high of 1.1865. At this point, it is better to sell GBP/USD immediately on a rebound, bearing in mind a possible bounce to the downside by 30-35 pips within the day.
Indicator signals:
Moving Averages
Trading below the 30 and 50-day moving averages indicates that bears can still push the pair lower.
Please note that the time period and levels of the moving averages are analyzed only for the H1 chart, which differs from the general definition of the classic daily moving averages on the D1 chart.
Bollinger Bands
A breakout of the lower band at 1.1740 will intensify the bearish pressure on the pair. In case the pair advances, the upper band at 1.1780 will serve as resistance.
Description of indicators:
• A moving average of a 50-day period determines the current trend by smoothing volatility and noise; marked in yellow on the chart;
• A moving average of a 30-day period determines the current trend by smoothing volatility and noise; marked in green on the chart;
• MACD Indicator (Moving Average Convergence/Divergence) Fast EMA with a 12-day period; Slow EMA with a 26-day period. SMA with a 9-day period;
• Bollinger Bands: 20-day period;
• Non-commercial traders are speculators such as individual traders, hedge funds, and large institutions who use the futures market for speculative purposes and meet certain requirements;
• Long non-commercial positions represent the total number of long positions opened by non-commercial traders;
• Short non-commercial positions represent the total number of short positions opened by non-commercial traders;
• The total non-commercial net position is the difference between short and long positions of non-commercial traders.