


US STOCKS OUTLOOK:
- S&P 500, Nasdaq 100 and Dow Jones sink after U.S. inflation data tops estimates
- Elevated price pressures in the economy may prompt the Fed to continue front-loading interest rate hikes in its coming monetary policy meetings
- With market sentiment deteriorating every day, risk assets will struggle to stage a meaningful rebound in the near term
Trade Smarter - Sign up for the DailyFX Newsletter
Receive timely and compelling market commentary from the DailyFX team
Most Read: US Dollar Price Action Setups - Prepping for Pullback? EUR/USD & USD/JPY
U.S. stocks suffered steep losses on Wednesday amid growing headwinds for the U.S. economy and increasingly lower risk-appetite on Wall Street. At the closing bell, the S&P 500 plunged 1.65% to 3,935, its weakest level since March 2021. The Dow Jones, for its part, fell 1.02% to 31,834, a new low for the year. Elsewhere, the Nasdaq 100 bore the brunt of the sell-off and plummeted 3.06% to 11,967 amid a major rout in the tech universe, with Apple, Microsoft and Amazon all plunging into free fall.
Although equity futures were trading sharply higher in the pre-market session, the upbeat sentiment shifted and did a 180-degree turn after the U.S. consumer price index for April delivered another negative surprise. For context, annual CPI cooled down to 8.3% from 8.5% in March, but the result came in two-tenths of a percent above expectations, a sign that broader price pressures are not yet easing significantly.The core indicator also topped consensus forecasts, printing at 6.3% year-over-year, only a modest decline from the 6.5% advance recorded at the end of the first quarter.
While the directional improvement in the headline and core gauge are welcome, Wednesday's data served as a firm reminder that the U.S. central bank has a long road ahead and a difficult path to restore price stability.Looking ahead, favorable base effects should help push year-over-year inflation numbers down, but with the underlying trend running well above desirable levels, the Fed is likely to retain a hawkish bias and continue to front-load interest rate hikes over the next couple of meetings to bring monetary policy to a neutral stance expeditiously.
Overall, with inflation hovering at four-decade highs, it is possible we have not yet reached peak hawkishness in central bank policy outlook. Against this backdrop, US Treasury yields may push higher in the near term, fueling recession fears and weighing on investors’ mood. In this environment, risk appetite will remain weak, preventing a meaningful equity market recovery. In fact, we may continue to witness the recent "sell the rip phenomenon," where traders fade any rally for fear that stocks will struggle to maintain gains.

NASDAQ 100 TECHNICAL ANALYSIS
After a significant drop on Wednesday, the Nasdaq 100 broke below a key support in the 12,210 and fell to a new 2022 low near 11,967. With the tech index in bear market and firmly biased to the downside, sellers could target the 11,600 level in the coming sessions. On further weakness, the next floor to consider appears around the 11,000-mark. On the flip side, if dip buyers return and manage to push the benchmark higher, initial resistance comes in at 12,210, followed by 12,645. If these hurdles are cleared, the focus shifts up to the 13,000 area.
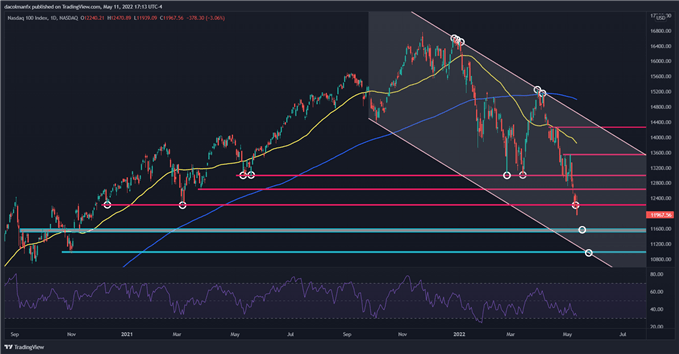
Nasdaq 100 Chart Prepared Using TradingView
EDUCATION TOOLS FOR TRADERS
- Are you just getting started? Download the beginners’ guide for FX traders
- Would you like to know more about your trading personality? Take the DailyFX quiz and find out
- IG's client positioning data provides valuable information on market sentiment. Get your free guide on how to use this powerful trading indicator here.
---Written by Diego Colman, Market Strategist for DailyFX


