 English
  Русский
 Bahasa Indonesia
 Bahasa Malay
 ไทย
ไทย Español
 Deutsch
 Български
 Français
 Tiếng Việt
 中文
中文 বাংলা
বাংলা हिन्दी
 Čeština
 Українська
 Română

Trend analysis (Fig. 1)
The price from the level of 1.1324 (closing of yesterday's daily candle) may continue to decline today in order to reach the lower fractal – 1.1298 (daily candle from 12/30/2021). Once this level is tested, it is likely to resume its growth to the target of 1.1369 – the upper border of the Bollinger line indicator (black dotted line).
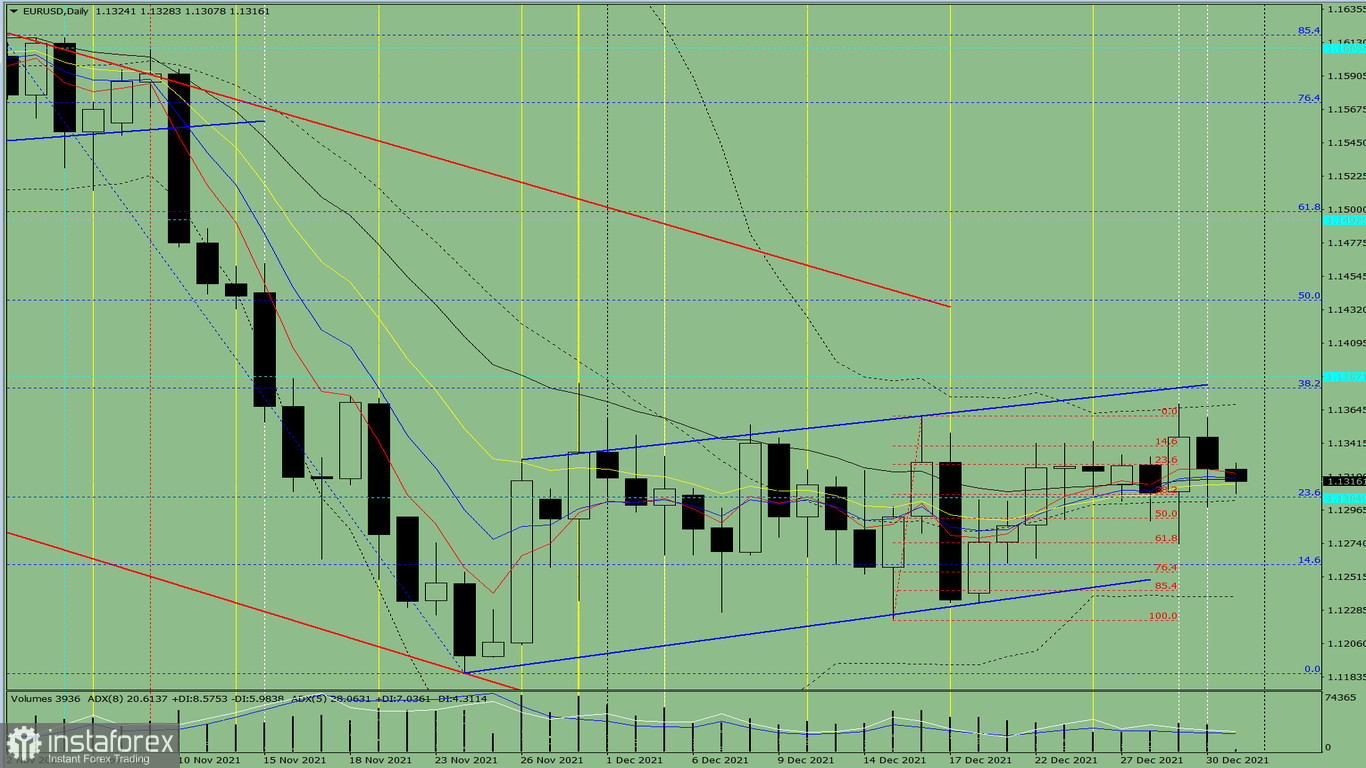
Fig. 1 (daily chart)
Comprehensive analysis:
- Indicator analysis - down
- Fibonacci levels - down
- Volumes - up
- Candlestick analysis - up
- Trend analysis - up
- Bollinger lines - up
- Weekly chart - up
General conclusion:
Today, the price from the level of 1.1324 (closing of yesterday's daily candle) may resume its downward movement to be able to reach the lower fractal – 1.1298 (daily candle from 12/30/2021). After testing it, it may rise again to the target of 1.1369 – the upper border of the Bollinger line indicator (black dotted line).
Alternatively, the price from the level of 1.1324 (closing of yesterday's daily candle) may continue to fall so that it can reach the lower fractal – 1.1273 (daily candle from 12/29/2021). After this level is tested, it may surge to the target of 1.1317 – 21 average EMA (black thin line).