
- Linking websites
The number of websites linking to this post.
This post's estimated monthly organic search traffic.

Vanity metrics don’t give you the insight you need to make good marketing decisions, leading you to pour resources into things that don’t matter for your business.
It’s better to pick a small set of meaningful numbers for any channel you work on and tie them to overall revenue goals.
But which metrics are right for each marketing channel, and how should you use them?
Here are 25 marketing metrics you should consider tracking:
Some numbers – such as revenue metrics – don’t belong to a specific channel but span all the work you’re doing. You’ll want to track most of these regardless of the area of marketing you’re working on.
1. Revenue growth
Revenue growth is the difference between two revenue numbers. For example: before and after a marketing campaign.
How to calculate it
Revenue Growth (%) = ((Revenue at end - Revenue at start) / Revenue at start) × 100
2. Customer Acquisition Cost (CAC)
CAC is the dollar amount it takes your business to acquire a customer. The lower the number, the better.
It’s primarily used in relation to other metrics like lifetime value (more on that later) to work out how much you can afford to acquire additional customers in the future.
How to calculate it
CAC = Total amount spent on marketing / Number of new customers acquired
3. Conversions
A conversion happens when a visitor to your website completes an action that you are tracking. Examples include sign-ups, demo bookings, and purchases.
Tracking conversions allows you to see where customers are completing key actions in their customer journey.
How to calculate it
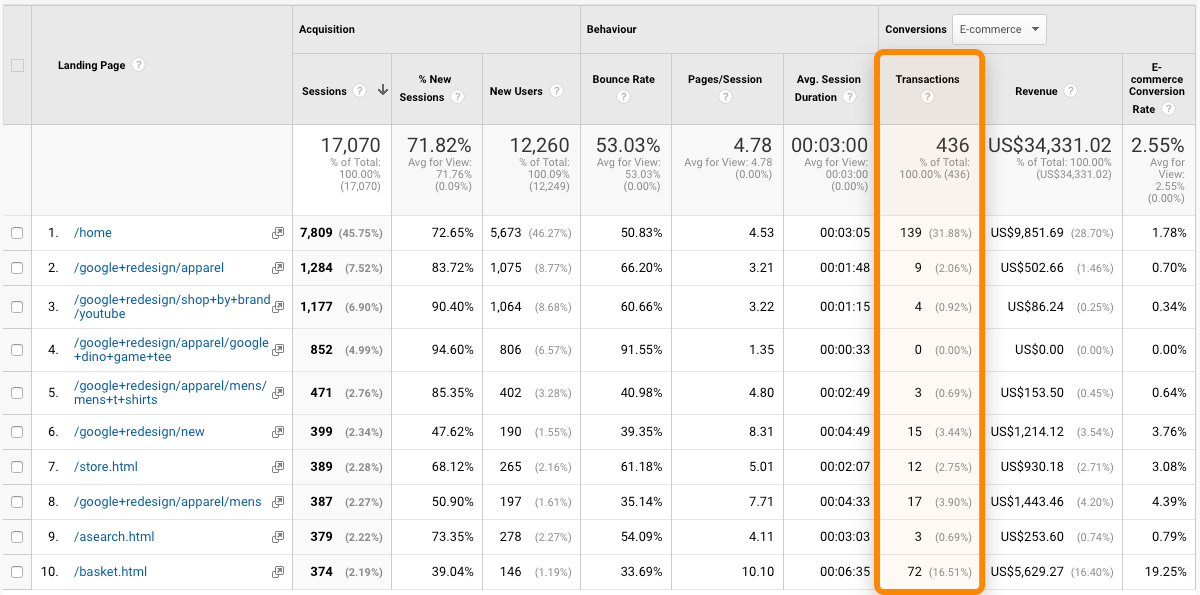
In Google Analytics, you can set up Goals and then track conversion rate (the percentage of people completing an action) across your site.
In the image below, we can see which pages visitors land on before purchasing a product. We can also see the conversion rate and the revenue attributed to the conversions:
4. Share of Voice (SOV)
Share of voice tells you how visible you are compared to competitors.
Market share and share of voice are closely tied to one another. If you’ve got a 20% share of voice, you’re likely to have a similar market share.
If your share of voice is above your market share relative to your competitors, you have an excess share of voice (eSOV). In the long term, your market share will likely catch up with your share of voice.
That means SOV can be an indicator of future growth.
How to calculate it
Share of voice = Brand visibility / Total potential visibility
It’s not practical to measure SOV for multiple channels simultaneously, so you’ll need to calculate it on a channel-by-channel basis.
Here’s how to do it for organic search:
- Create a list of important keywords
- Add them to Rank Tracker
- Go to the Competitors report
- Check the Visibility column
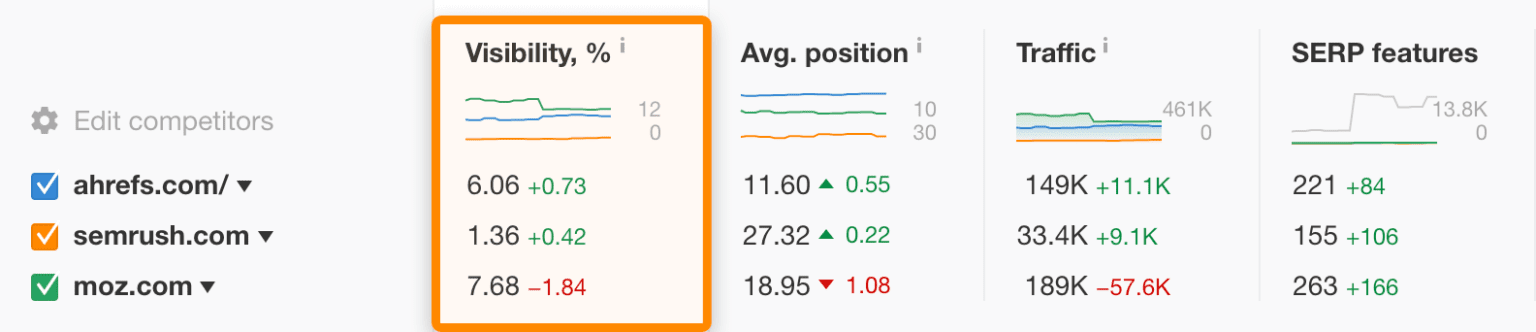
Here you can see the percentage of clicks you’re winning for tracked keywords compared to competitors.
Recommended reading: What Is Share of Voice? How to Measure It Across Channels
5. Return on Investment (ROI)
ROI is a measure of the impact a campaign or channel had on the revenue of the business.
How to calculate it
ROI = (Revenue attributed to marketing spend - Marketing spend) / Marketing spend
The higher the number, the better the ROI.
ROI is easiest to calculate through channels like paid advertising, where advertising pixels can effectively track the journey from lead to customer.
Marketing isn’t only about attracting new customers but also retaining existing customers. The longer you keep a customer, the more profit you’ll make from them.
6. Churn rate
Churn is the rate at which customers stop paying you. It’s prevalent in software as a service (SaaS) businesses that rely on recurring revenue to grow.
How to calculate it
Churn rate = (Revenue lost during period / Revenue at start of period) x 100
High churn can be an indicator of poorly positioned products. If your customers are canceling their accounts because your product doesn’t do what they thought it did, you should revisit your website’s sales pages and try to clarify your value proposition.
7. Lifetime Value (LTV)
LTV shows how much on average a customer pays you across their whole relationship with your business.
How to calculate it
For an ecommerce business:
LTV = Avg. Order Value x Avg. Annual Purchase Frequency x Avg. Customer Lifespan
To calculate LTV for a SaaS business:
LTV = Avg. Monthly Revenue Per Customer / Avg. Monthly Churn Rate
If your business is new, it will take some time to get LTV numbers because you don’t know how long the average customer will pay you.
8. LTV:CAC
LTV to CAC ratio tells you how much you can reasonably spend to acquire a new customer.
For example, if your average customer pays you $30, spending up to $29.99 to get a customer would be a success. However, you’d end up with only a 1 cent profit which leaves zero room for margin.
How to calculate it
There is no single ratio that works for every business because there’s no specific number you should pay for a customer. It varies by time, business and industry.
9. Net Promoter Score (NPS)
NPS is a widely used metric to measure customer satisfaction levels. Dissatisfied customers will often give low scores indicating that they’re likely to churn in the future.
How to calculate it
NPS = Percentage of Promoters - Percentage of Detractors
Using a single strictly-defined survey question, NPS asks: ‘How likely are you to recommend {Company Name} to a colleague?’
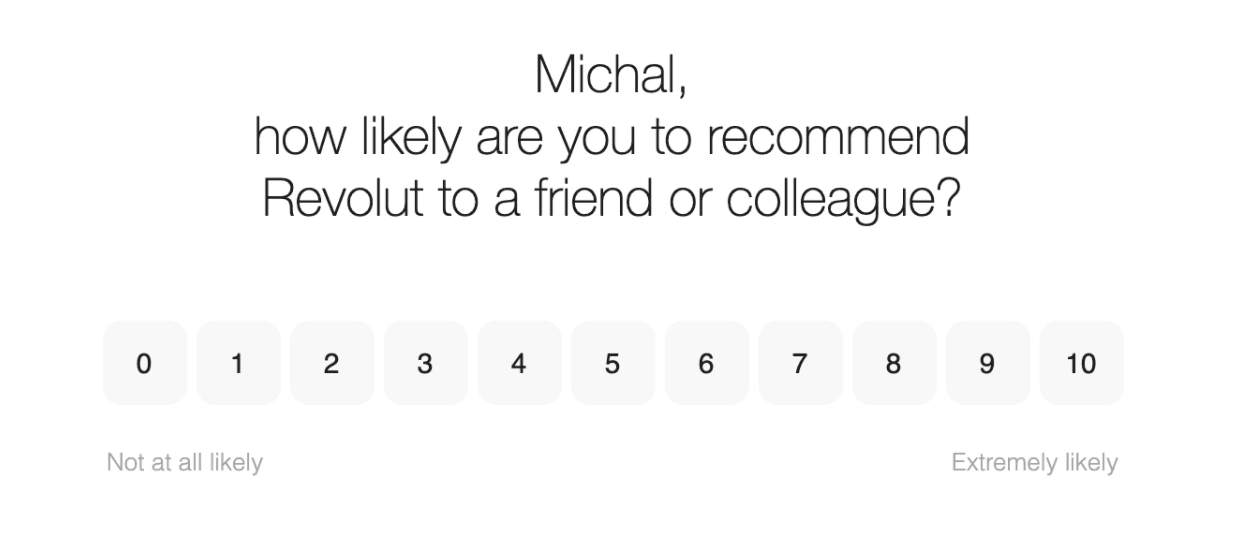
Scores range between 0 and 10. Anyone who scores between 0-6 is a detractor, 7-8 scores are neutral, and 9-10 scores are promoters.
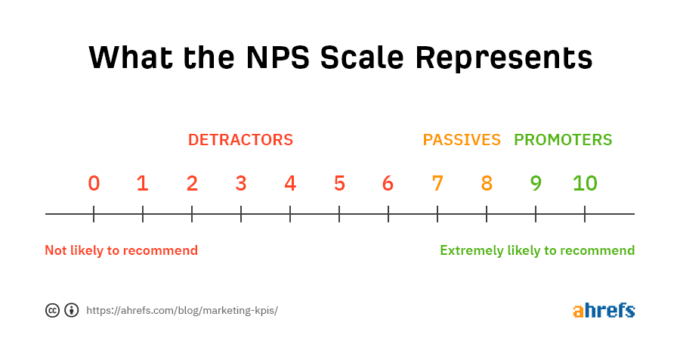
NPS scores range from -100 to 100, and a score greater than 70 is considered ‘world class.’
10. Repeat Purchase Rate
Repeat Purchase Rate is the percentage of customers who buy from you more than once.
It’s widely used in ecommerce to predict how effective a business is at retaining customers.
How to calculate it
Repeat Purchase Rate = Number of customers who more than once / total number of customers
A high repeat purchase rate shows healthy retention and that you can spend more money on getting new customers.
Search is a fantastic channel for growing your business. But it’s important to make sure that you’re on the right path and that the strategy you’re following is working.
Use these SEO metrics to keep tabs on traffic growth from search.
11. Branded vs. non-Branded Organic Traffic
It’s often helpful to know how many people find your website based on searches for your company name and related terms (branded) vs. everything else (non-branded).
If most people find you by searching for your brand name on Google, you’re likely missing out on a lot of customers who are just searching for solutions to their problems.
How to calculate it
You can estimate the ratio of branded to non-branded traffic in Google Search Console.
Head to the Performance tab. From here, you’ll need to filter for branded searches from your report. Then add your brand name and any variations/misspellings to the query field, selecting ‘queries containing’ as the operator. Click Apply:
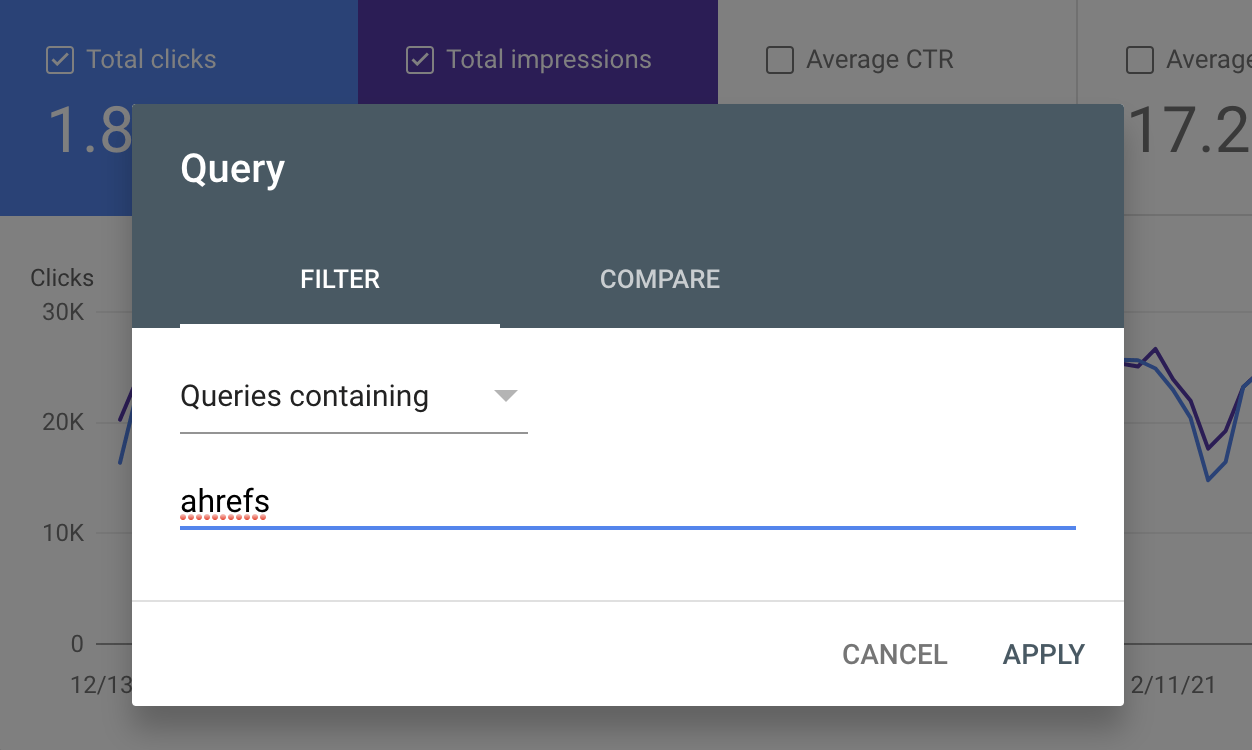
When you’re done adding those filters, make a note of the ‘Total Clicks’ number. This is your branded traffic figure.
Then change all your branded term filters’ operators to ‘Queries Not Containing’ and make a note of the ‘Total Clicks’ number again.
This will give you the amount of traffic for branded traffic vs. non-branded traffic.
12. Brand mentions
Brand mentions show you how frequently you’re part of the conversation in your industry.
When a web page mentions your company or closely related terms like prominent employees (in relation to their work), you have received a brand mention.
How to track it
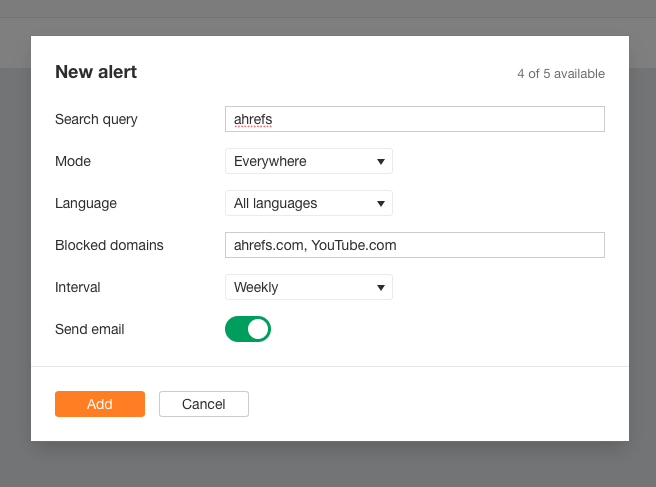
If you want to be alerted when someone mentions your brand in the future, use Ahrefs Alerts.
- Go to Ahrefs Alerts
- Click the “Mentions” tab
- Click “Add alert”
- Enter your brand name
- Choose languages
- Exclude domains you don’t want to track
- Set your alert interval
- Click “Add”
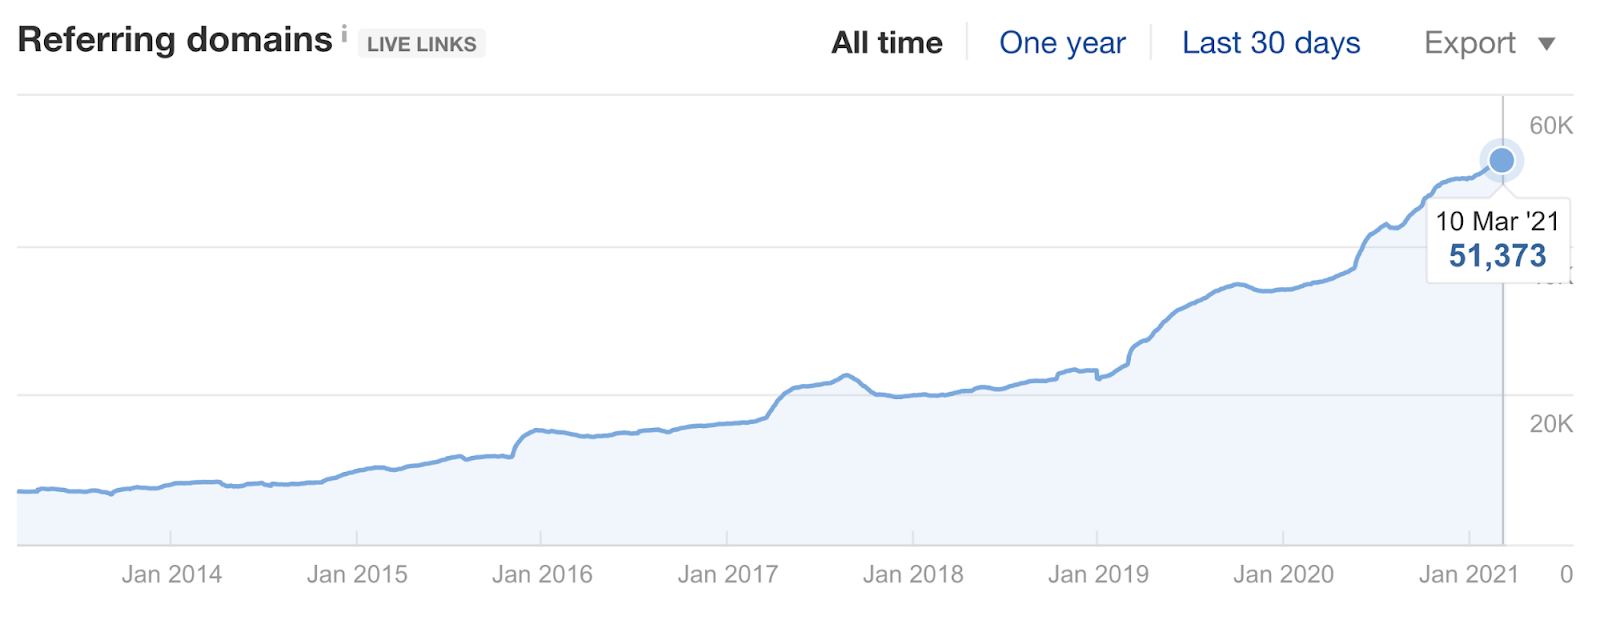
13. Backlink growth
Backlinks are links to your web page from other web pages on the internet.
A good backlink profile will help you rank better in search and drive relevant referral traffic. Ranking for keywords that your target customers are searching for will help you acquire users at decreasing cost over time.
How to calculate it
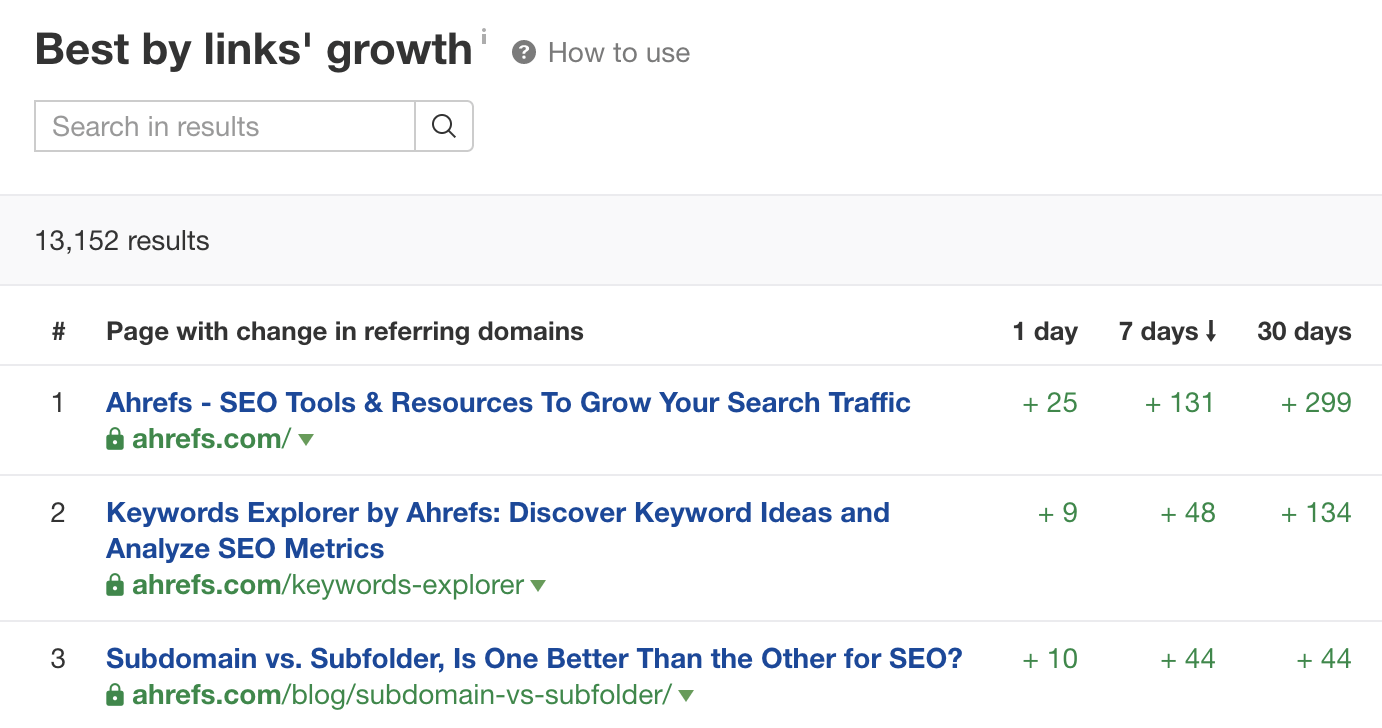
You can check the growth in referring domains to any site in Site Explorer.
Using the Best by Links Growth report, we can see which pages have gained or lost backlinks in the previous 1, 7, and 30 day period:
Inefficient paid advertising spend will burn through your cash at an alarming rate.
Instead of leaving it to chance, track the following metrics to ensure the ad spend is paying off.
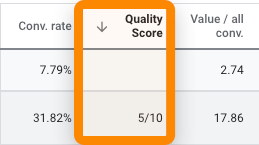
14. Quality Score
Google Ads uses Quality Score to estimate how relevant an ad is to a potential searcher.
How to calculate it
Google calculates it for you.
Quality Score consists of three main factors:
- Expected click through rate
- Ad relevance to the keyword
- Landing page experience
High-scoring ads (on a scale of 1-10, where ten is highest) win better placements and cost less in general.
Knowing this will give you lots of scope for improving your Quality Score by making changes to your landing page, improving your targeting, or changing ad copy to make it more appealing.
15. Cost Per Click (CPC)
Cost Per Click is a number that shows the price that you pay every time someone clicks your ad.
How to calculate it
CPC = Total cost of clicks / total number of clicks
Cost Per Click varies between keywords, but you can get an average CPC in Keywords Explorer while doing keyword research:
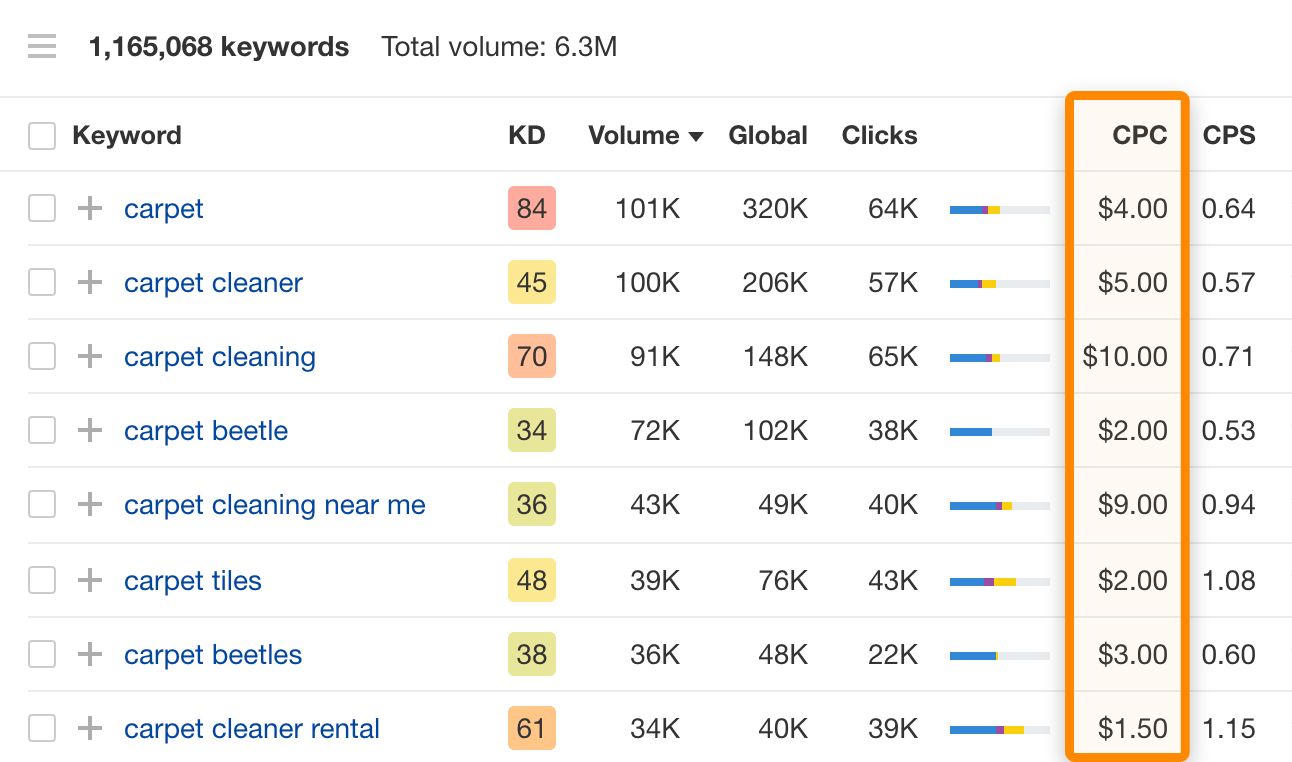
It’s a helpful number to know so that you can think about your bidding strategy on existing and future campaigns.
16. Cost Per Conversion
Cost Per Conversion tells you how much it costs per conversion from your ads.
How to calculate it
Cost per Conversion = Total Amount Spent / Total Number of Conversions
That allows you to decide whether it’s an effective use of your marketing budget.
17. Return on Ad Spend (ROAS)
ROAS is the dollar return on your ad spend
How to calculate it
ROAS = Total Conversion Value / Amount Spent
ROAS is similar to Cost Per Conversion. However, ROAS factors in only conversions with a dollar amount attached, whereas Cost Per Conversion includes conversions like ‘download PDF’ that have no immediate monetary value.
18. View-through conversions
View-through conversions are when customers see but don’t interact with your ad and then later complete a conversion on your site.
How to calculate it
Ad networks know how to attribute conversions to clicks and views because they require you to install a pixel on your site before launching your campaigns.
The pixel gathers data about people who visit, including where they came from.
For example, if a user sees your ad, scrolls past it, and then visits your website 30 days later to make a purchase, a view-through conversion will be added to your campaign stats.
If your sales cycle is longer than 30 days, you’ll want to set the look-back window on campaigns to a length that’s appropriate for your business.
Unlike search and paid traffic, owned channels like email are ‘always on.’ Your subscribers have given you consent to contact them directly in their inbox.
These metrics show you where you’re keeping their trust and when you need to improve.
19. Subscriber growth rate
Subscriber growth rate is the percentage difference between subscribers at the start and end of a period (month/year/all-time).
How to calculate it
Subscriber Growth Rate (%) = ((Subscribers at end of period - Subscribers at start of period) / Subscribers at start of period) x 100
Growing email lists create new opportunities for engaging potential customers.
Measuring your mailing list growth rate over time is a much better metric than a standalone subscriber count figure.
Subscriber growth rate gives you insights into how quickly you’re growing your lists.
20. Open rate
Open rate is the percentage of subscribers who opened your email.
How to calculate it
Open rate = (Emails opened / (Emails sent - bounces)) * 100
You shouldn’t use a high open-rate as a sign of good engagement. A lot of people will open emails and not read or interact with them. Sometimes they’re just opening to press the delete button. Open-rate doesn’t distinguish between bad and good opens.
Still, open-rate could give you some general insights into how well your subject line and excerpts are landing with your audience.
21. Click rate
Click rate is the percentage of recipients that click a link in your email.
How to calculate it
Click rate = (Emails clicked / (Emails sent - bounces)) * 100
Link clicks in emails almost always indicate that your content has piqued a reader’s interest. To that extent, click rate is a reliable measure of engagement that you can track as a KPI for email.
Most email service providers (ESPs) will give you click rate data on a campaign level as well as an account level.
22. Unsubscribe rate
Unsubscribe rate is the percentage of recipients who unsubscribe after receiving your email.
How to calculate it
Unsubscribe rate = (Unsubscribers / (Emails sent - bounces)) * 100
Tracking the unsubscribes rate from your campaigns is useful when the numbers on your recent campaigns are high. If someone unsubscribes, you can no longer send them messages, which will likely impact your ability to sell them additional products/services.
If you’re seeing many people unsubscribe, chances are there’s a problem with your messages or your marketing is generally not meeting the expectations of your subscribers.
23. Bounce rate
Bounce rate is the percentage of emails that weren’t delivered because an email address is incorrect, doesn’t exist, or the email server blocked delivery for some other reason.
How to calculate it
Bounce rate = (Number of bounces / Emails sent) * 100
Bounce rate can have a knock-on effect on your business because marketing messages aren’t reaching potential customers. In which case, they might be less likely to buy from you in the future.
Bounce rate can also indicate the health of your mailing list. If you have a high hard bounce rate, you may be attracting lots of false emails.
Social media metrics are tricky because social networks operate on secretive and often changing algorithms.
In addition to that, each social network defines metrics differently. For example, here’s what constitutes a video view on different social networks:
- Facebook/Instagram – 3 seconds
- YouTube – 30 seconds
- Twitter – 2 seconds when 50% of the video frame is visible
- LinkedIn – 2 seconds when 50% of the video frame is visible
The upshot is tracking metrics on social media is difficult and prone to change. You have to ask the question: is it worth making these metrics part of the reporting at all?
24. Engagement
Engagement is a broad category that includes each social network’s specific post actions.
How to track it
You can use each social network’s built-in analytics tools to get engagement numbers. Alternatively, using a social media analytics tool like Buffer Analyze.
However, there is no standardized set of actions across social media.
For example:
Twitter – likes, retweets, quote tweets, replies, profile clicks
Facebook – shares, views, likes/reactions, comments, clicks
LinkedIn – impressions, comments, shares, reactions
This means it can be tough to compare the value of engagement between social networks.
25. Brand mentions
Brand mentions refer to the number of times your brand name gets mentioned on social media in a given period.
How to track it
You can use a tool like Hootsuite to track this, where you can even segment by sentiment to help understand how positive your audience is feeling towards your brand.
Tracking mentions of your brand on social media gives you insight into how customers perceive the marketplace.
For example, suppose your brand name is getting consistent mentions on social media. That may be a good sign that you should continue to invest in social media as a marketing channel.
Final thoughts
The famous Peter Drucker quote goes: “What gets measured, gets managed.”
But just because you’re staring at Google Analytics for hours on end doesn’t mean you’re effectively tracking marketing metrics. If you’re not tracking your marketing impact on the bottom line, how will you know where to invest in the future?
Instead, choose the right metrics for your marketing channels, manage them over time and focus on growing the business’ profits.
Got questions? Ping me on Twitter.


Social media metrics