![How much does the population of Asian countries grow/decline every year?
by u/efisha
[[MORE]]The map was fully based on one source. To find the data, go to ‘Average annual rate of population change (percentage)’ then choose 'Sustainable Development...](https://64.media.tumblr.com/a97c1bb4c43a47e821e0d961c9764c9a/c3ebb4ad5ec48d58-81/s1280x1920/48095bd6c70ef2e9a0a8b40883afea0864f6f3a7.jpg)
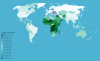
How much does the population of Asian countries grow/decline every year?
by u/efisha
The map was fully based on one source. To find the data, go to ‘Average annual rate of population change (percentage)’ then choose 'Sustainable Development Goals (SDG) regions’ to see the results by country.
The source does not specify the reasons for the increase/decline of the population in each country. Soon, I’ll post a map of life expectancy at birth in Asia and by overlapping these maps interesting correlations might be discovered but it is surely not enough to explain the annual population change.
For more maps, check out my instagram page.
Related Posts

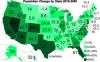
![Michigan population change from 2000 to 2010 by county.
[[MORE]]by Poshact
“Source: http://d-maps.com/carte.php?num_car=20676&lang=en
For some background, Michigan was the only state to lose population from the 2000-2010 census (Puerto Rico also...](https://64.media.tumblr.com/cd38bd7e755eb0dd0c7746d45be38b03/tumblr_oslv0gXUh31rasnq9o1_100.png)

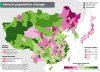
![Natural population change in Europe, 2017.
[[MORE]]by bezzleford:
Sidenotes:
What does this map show? - it shows the natural population change of countries in Europe for 2017 (or 2016 if data for 2017 was unavailable).
Which countries had the biggest...](https://64.media.tumblr.com/a306cc1f2e3bae10f3246438d5843e03/tumblr_pay1y90GfT1rasnq9o1_100.png)
![US counties population change between 2010 and 2016.
[[MORE]] mucow:
About a month ago, shc1xyz posted a map of US counties (and equivalents) showing population change between 2010 and 2016. I was curious as to the actual percentages, so I made...](https://64.media.tumblr.com/038ab1347ebaa27e6d766e8f53298bf0/tumblr_p278d3289h1rasnq9o1_100.jpg)
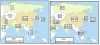
![Average annual rate of population change % in Europe and around. UN 2017 Revision.
[[MORE]]by Marcipanas
This map shows the medium variant (most likely scenario as per UN) of expected annual % change of population between 2015 and 2020 in Europe and...](https://64.media.tumblr.com/a8bc55eb6f460834784bcaf5765cf653/tumblr_os1hotXcvW1rasnq9o1_100.png)