


Bitcoin (BTC/USD) Price, Analysis and Chart:
- A period of consolidation before the next leg higher?
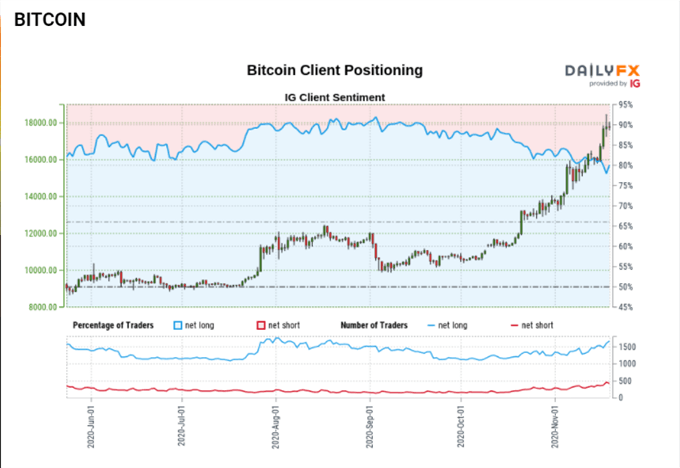
- Retail traders remain long and in profit.
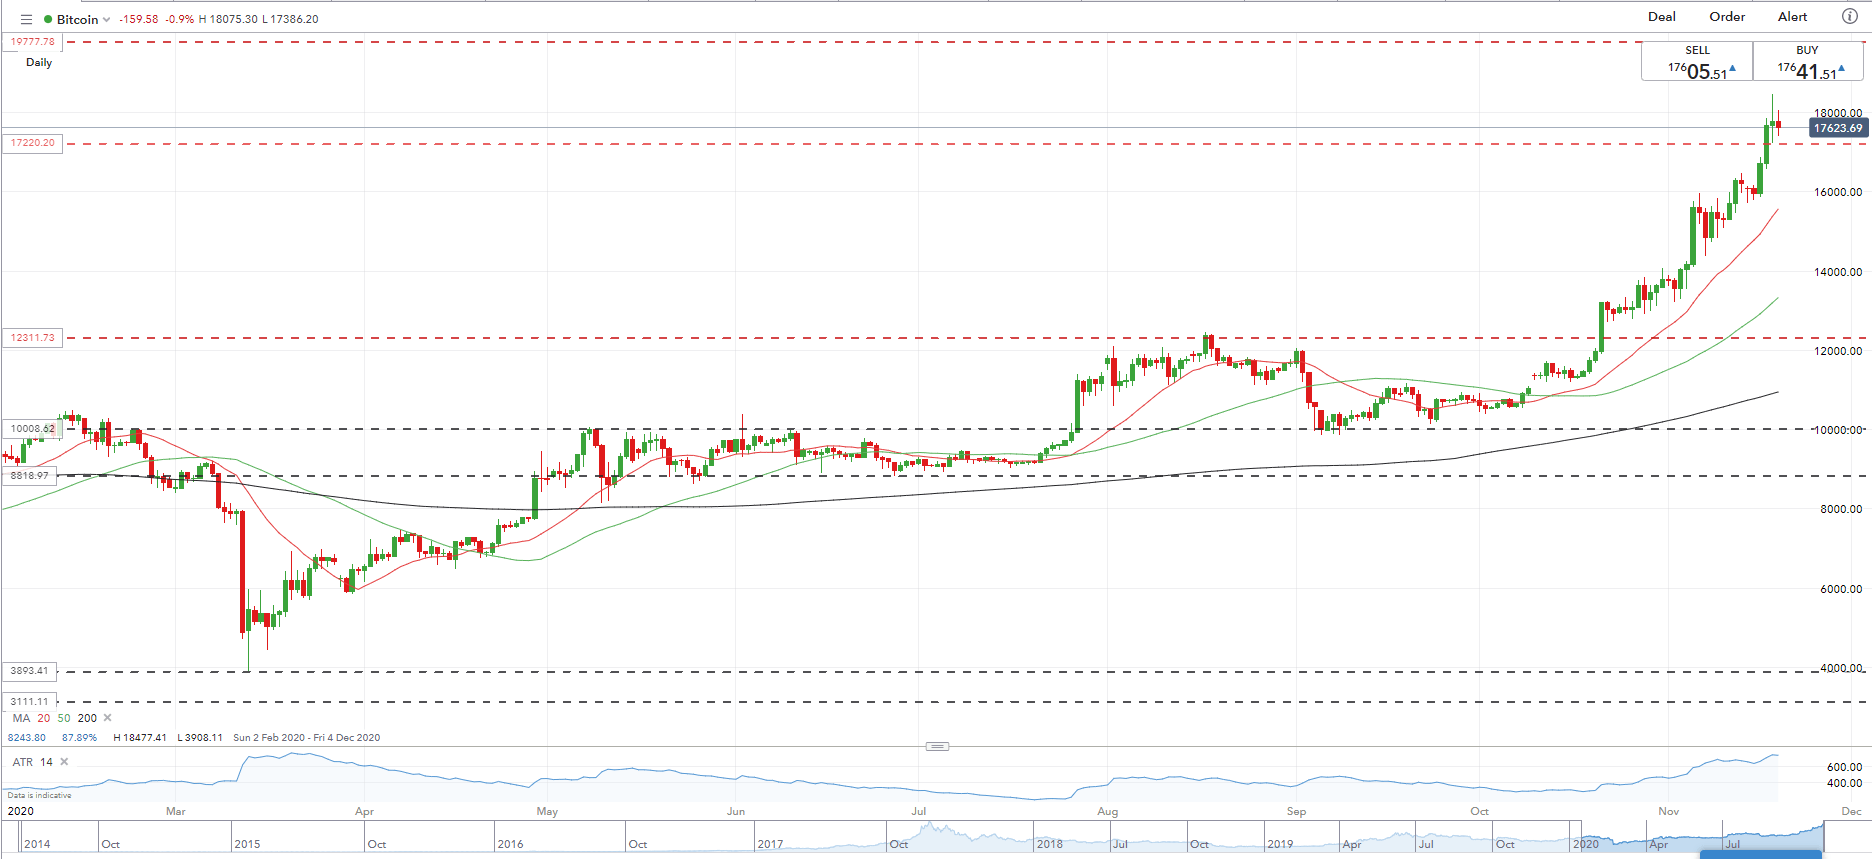
I noted last week that ‘the path of least resistance for Bitcoin is higher’ and that there was little in the way of horizontal resistance until $17,200, and while the directional call was spot on, I underestimated the inherent volatility in Bitcoin which saw it print a fresh near 3-year high just under $18,500 yesterday.
Bitcoin (BTC) Outlook – Positive Outlook But Beware of Volatility Risk
Bitcoin is now back to around the $17,500 level and should use the previously mentioned $17,200 as support instead of resistance now, backed up by the Monday high at just under $16,900. The medium-term series of higher lows and higher highs remain in place although a print above Tuesday’s high near $18,500 will add further confirmation of this trend. The rest of the chart remains positive and Bitcoin is likely to resume its push towards a fresh all-time high in the near future, all things being equal.

Bitcoin (BTC/USD) Daily Price Chart (February – November 19, 2020)

IG client sentiment data show80.36% of traders are net-long with the ratio of traders long to short at 4.09 to 1.Positioning is more net-long than yesterday but less net-long from last week. The combination of current sentiment and recent changes gives us a further mixed Bitcoin trading bias.
Traders of all levels and abilities will find something to help them make more informed decisions in the new and improved DailyFX Trading Education Centre
What is your view on Bitcoin – bullish or bearish?? You can let us know via the form at the end of this piece or you can contact the author via Twitter @nickcawley1.


