The 1.1688 to 1.1698 is home to a cluster of technical levels.
The EURUSD is trading down, up and back down again. The pair is lower on the day (closed at 1.17048). The low today extended to 1.16712. The high reached 1.17167. We currently trade around 1.1688.
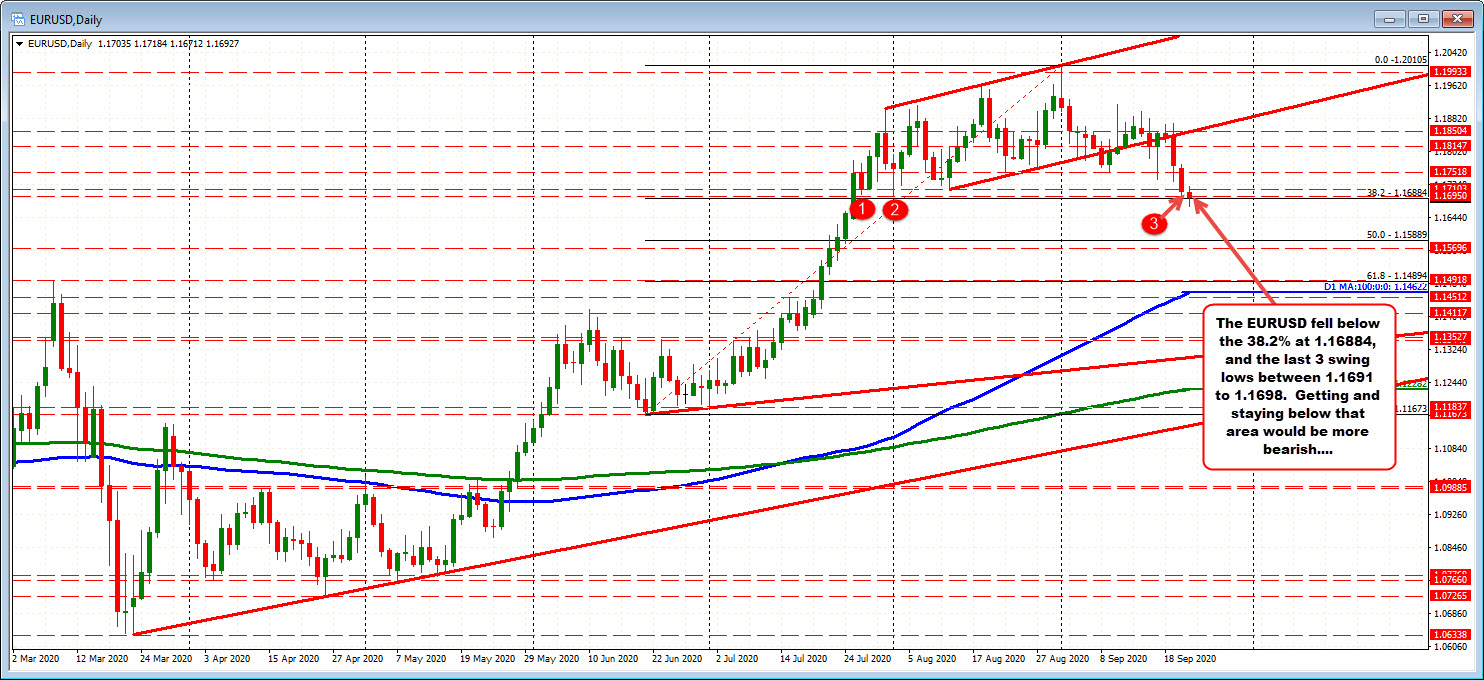
Technically the pair has moved above and below a cluster of support between 1.1688 and 1.1699. Looking at the last 3 lows on the daily chart going back to the end of July, those lows came between 1.1691 and 1.1698. Just below that area is the 38.2% retracement of the move up from the mid June low to the high reached in the beginning of September. That retracement level comes in at 1.16884.
The price has moved above and below that area in trading today. We are currently trading right around that level at 1.1689.
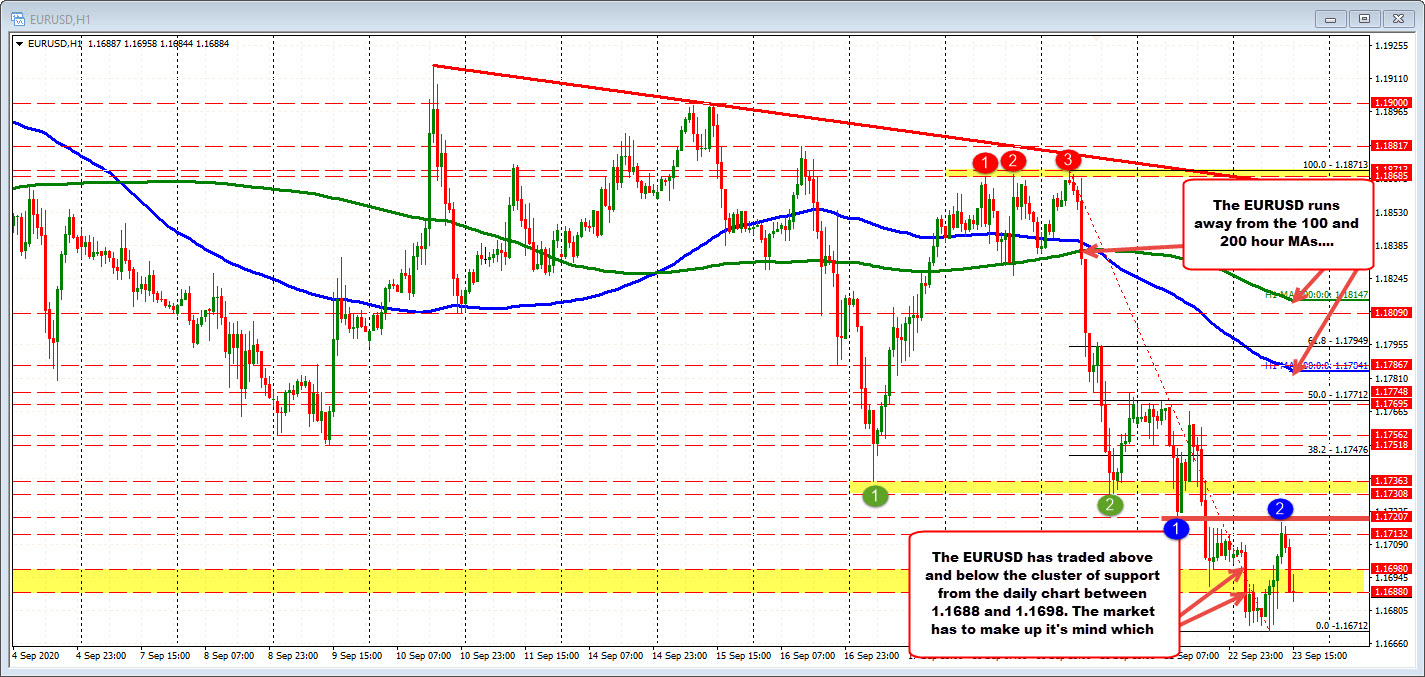
Given the up-and-down nature of the market action today (see hourly chart below), traders are unsure as to the next break.
However be aware of the area from the daily and momentum away from the level in trading today.
Looking at the hourly chart below, the sellers have more of the advantage with the price trading near its low levels going back to the end of July, and being negative on the day, moving away from its hourly moving averages (see blue and green lines in the chart below, and given the overall dollar bullishness of late. The price high today also stalled near a swing low from yesterday's trade keeping a step down progress in play (at 1.1720 area – see hourly chart below).
For the dip buyers against the cluster of support area, it would take a move above the swing area and then the 1.17207 and 1.1730-36 area to give buyers more confidence.