Get 40% Off
👀 👁 🧿 All eyes on Biogen, up +4,56% after posting earnings. Our AI picked it in March 2024.
Which stocks will surge next?
Unlock AI-picked Stocks

EUR/USD, USD/JPY Fibonacci Retracements Analysis

Published 09/22/2020, 05:34 AM
Updated 07/09/2023, 06:32 AM

EUR/USD

As we can see in the H4 chart, the divergence made the pair reverse after testing the resistance at 1.2000 and start a new correction. At the moment, the pair is heading towards 23.6% fibo at 1.1708 and may later continue falling to reach 38.2% fibo (1.1520). However, if EUR/USD breaks the high at 1.2011, it may continue trading upwards to reach the long-term 76.0% fibo at 1.2095.
EURUSD_H4
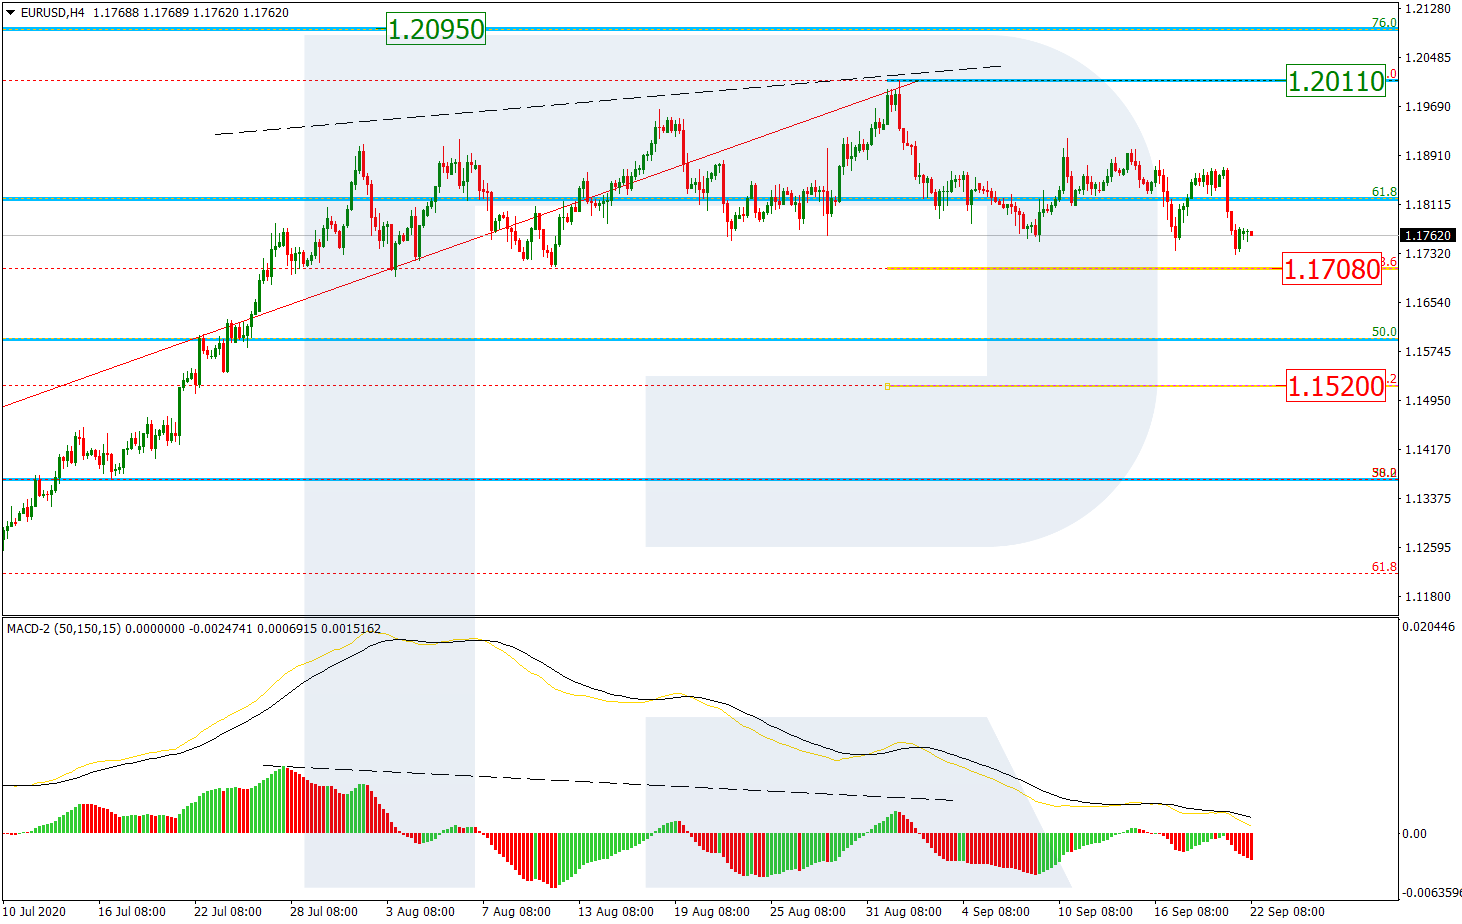
The H1 chart shows a local pullback after a quick descending impulse; it has already reached23.6% fibo but may later continue moving towards 38.2% and 50.0% fibo at 1.1785 and 1.1802 respectively. However, if the price breaks the local low at 1.1732, the asset may fall and reach 23.6% fibo at 1.1708.
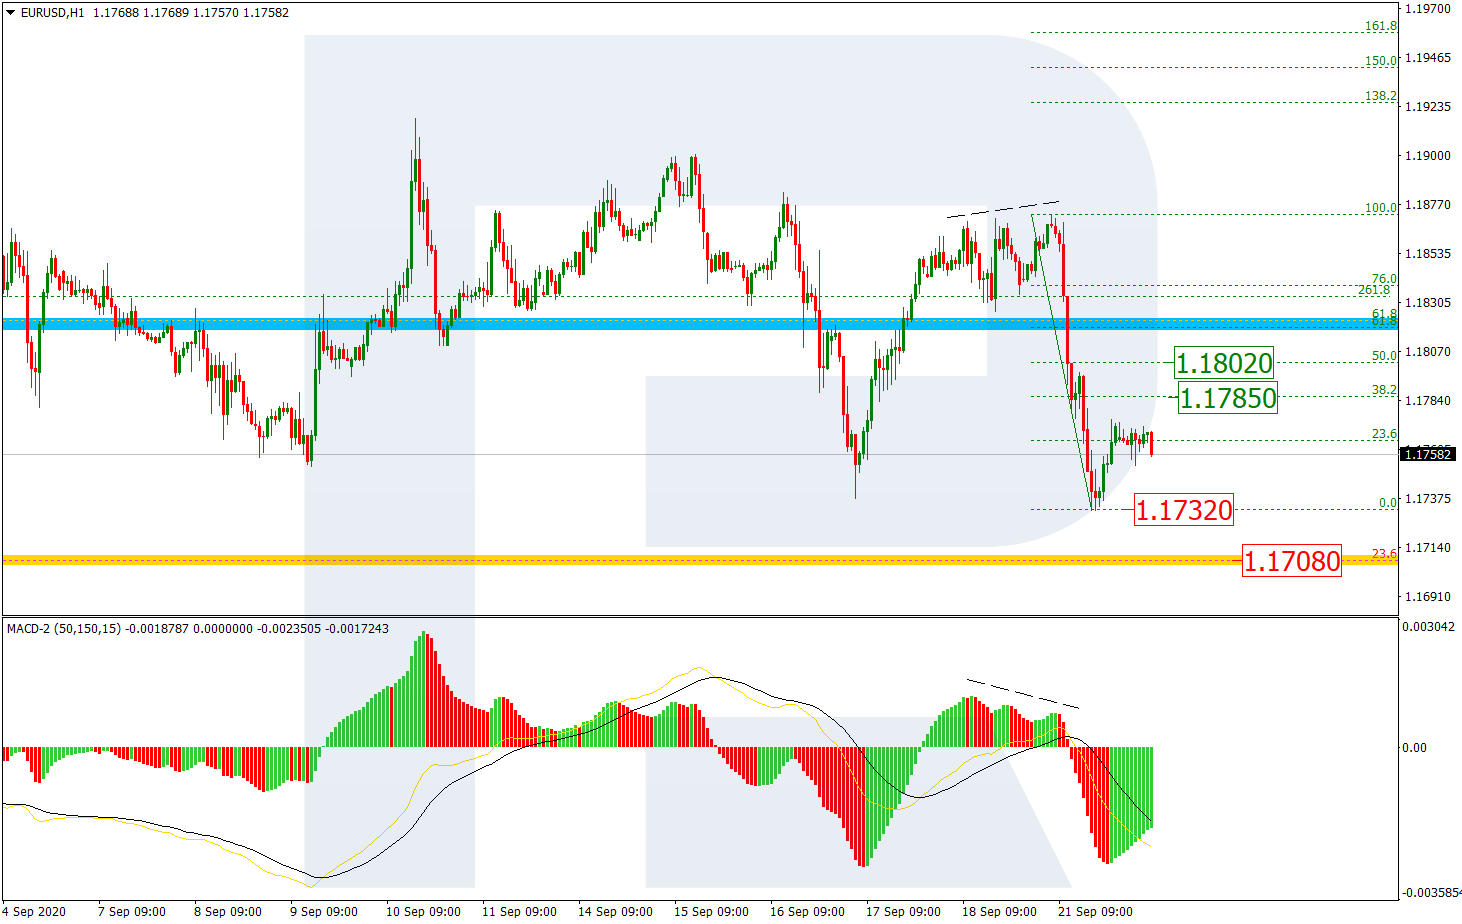
EURUSD_H1

USD/JPY

As we can see in the USD/JPY H4 chart, after breaking 61.8% fibo and attempting to reach 76.0% fibo at 103.70, the downtrend is slowing down. If the pair tests and breaks the latter level, the instrument may continue falling towards the fractal low at 101.18. In the nearest future, the market is expected to correct to reach 61.8% fibo at 105.20.
USDJPY_H4
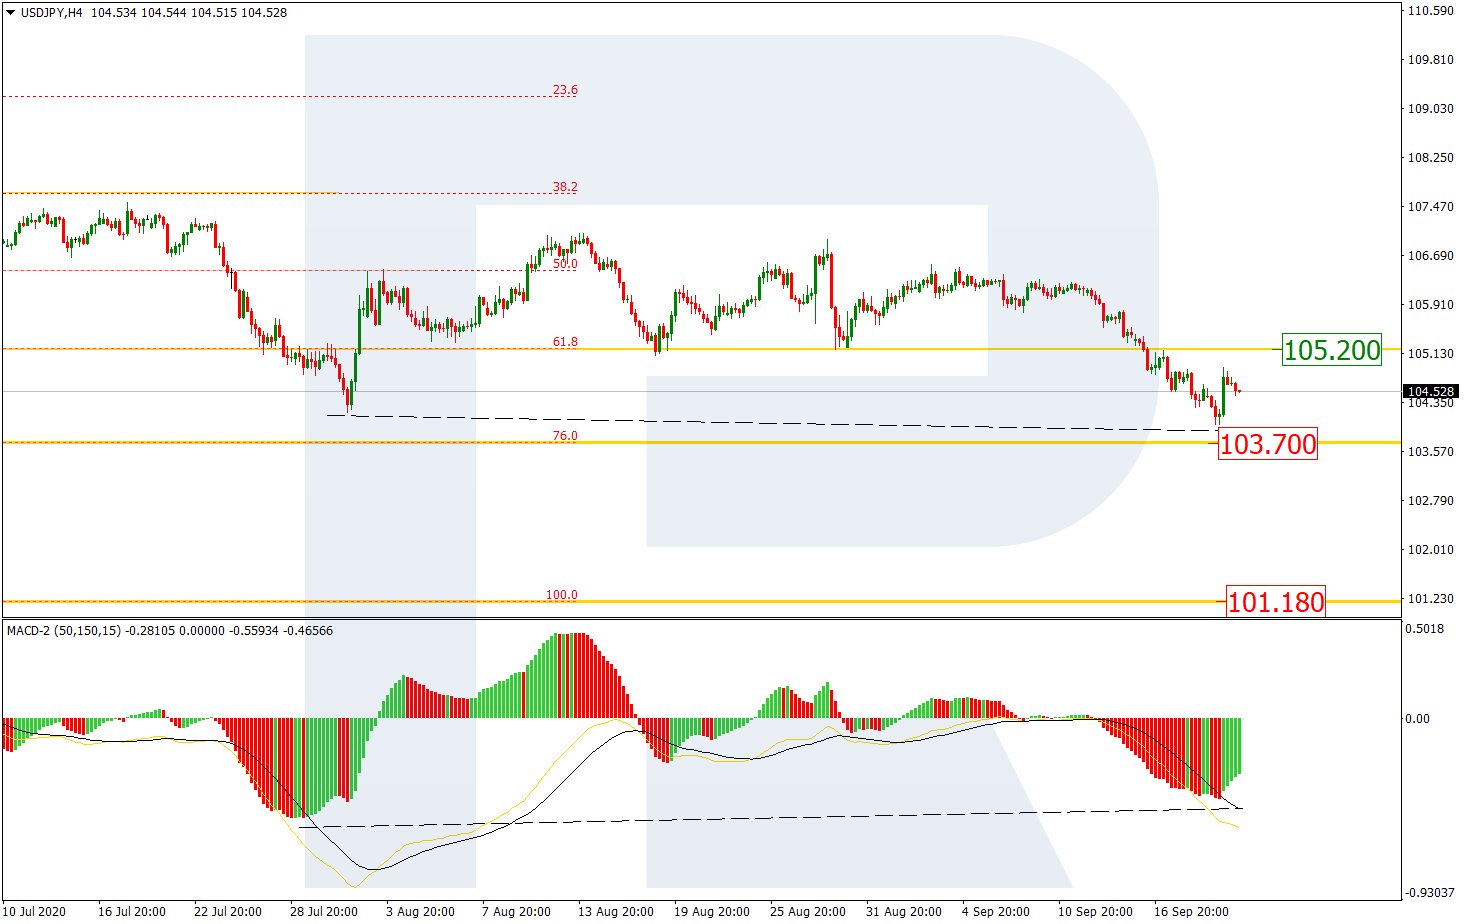
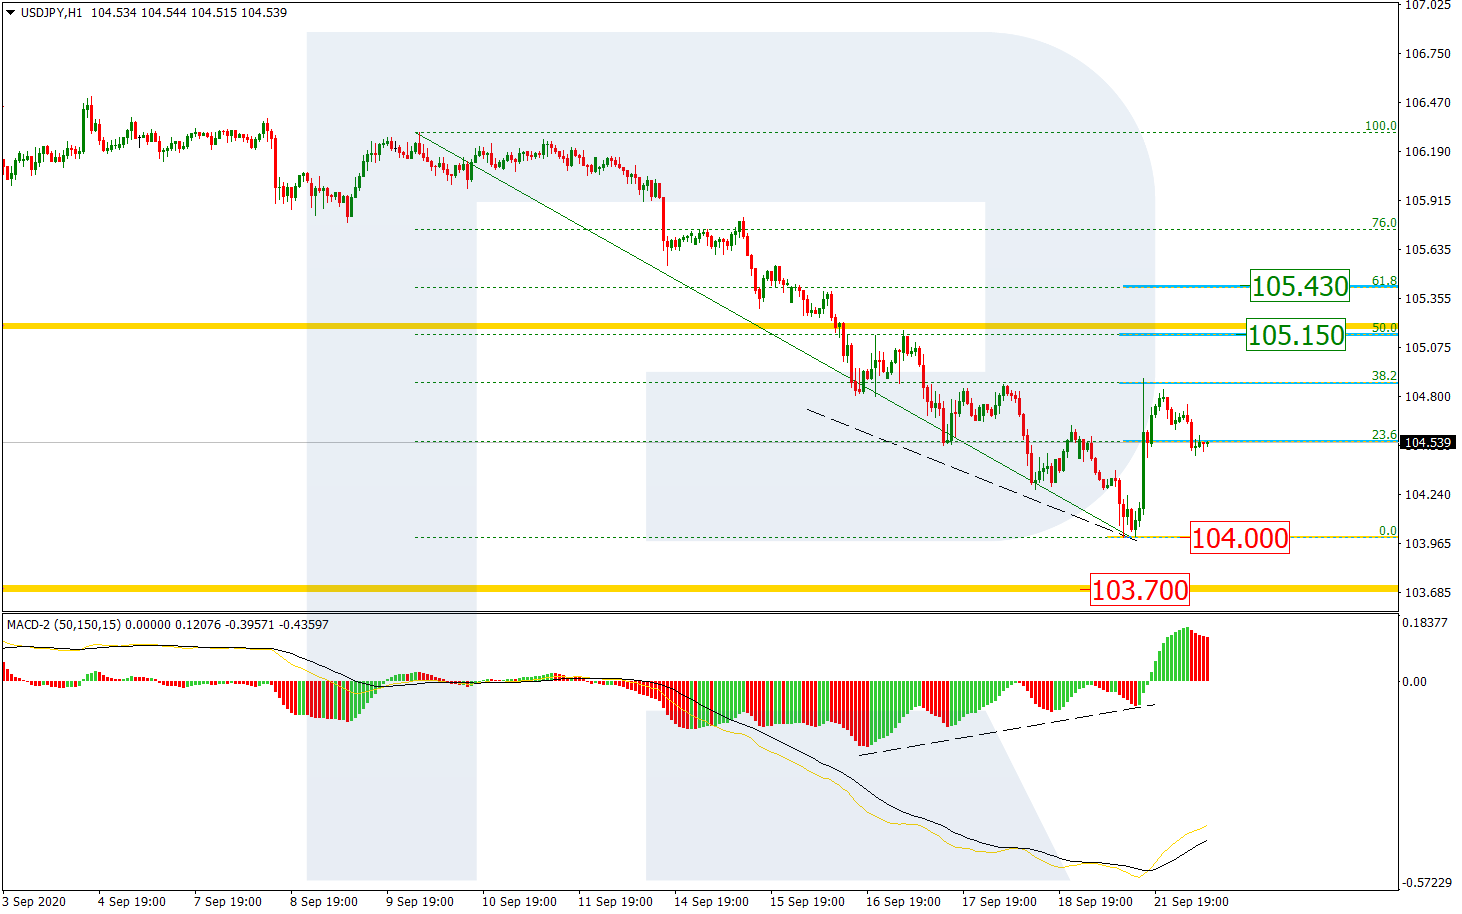
The H1 chart shows that the asset has completed a quick correctional wave to the upside after the convergence, which has reached 38.2% fibo. Later, the price may continue moving towards 50.0% and 61.8% fibo at 105.15 and 105.43 respectively. If the price breaks the low at 104.00, the downtrend will continue.
USDJPY_H1

Latest comments

Risk Disclosure: Trading in financial instruments and/or cryptocurrencies involves high risks including the risk of losing some, or all, of your investment amount, and may not be suitable for all investors. Prices of cryptocurrencies are extremely volatile and may be affected by external factors such as financial, regulatory or political events. Trading on margin increases the financial risks.
Before deciding to trade in financial instrument or cryptocurrencies you should be fully informed of the risks and costs associated with trading the financial markets, carefully consider your investment objectives, level of experience, and risk appetite, and seek professional advice where needed.
Fusion Media would like to remind you that the data contained in this website is not necessarily real-time nor accurate. The data and prices on the website are not necessarily provided by any market or exchange, but may be provided by market makers, and so prices may not be accurate and may differ from the actual price at any given market, meaning prices are indicative and not appropriate for trading purposes. Fusion Media and any provider of the data contained in this website will not accept liability for any loss or damage as a result of your trading, or your reliance on the information contained within this website.
It is prohibited to use, store, reproduce, display, modify, transmit or distribute the data contained in this website without the explicit prior written permission of Fusion Media and/or the data provider. All intellectual property rights are reserved by the providers and/or the exchange providing the data contained in this website.
Fusion Media may be compensated by the advertisers that appear on the website, based on your interaction with the advertisements or advertisers.
© 2007-2024 - Fusion Media Limited. All Rights Reserved.