The U.S. is experiencing a record-breaking heat wave, and you can use the Current Weather and Wind Station Data layer in Living Atlas of the World to monitor conditions using data from NOAA.
This layer is one of my favorites in Living Atlas because it provides 10-12 variables for each airport weather station across the world and updates every hour. But with so many options, the map can become confusing pretty quickly. So let’s set some goals.
- Display heat index (the “feels like” temperature)
- Include wind information
- Provide ancillary information such as dew point
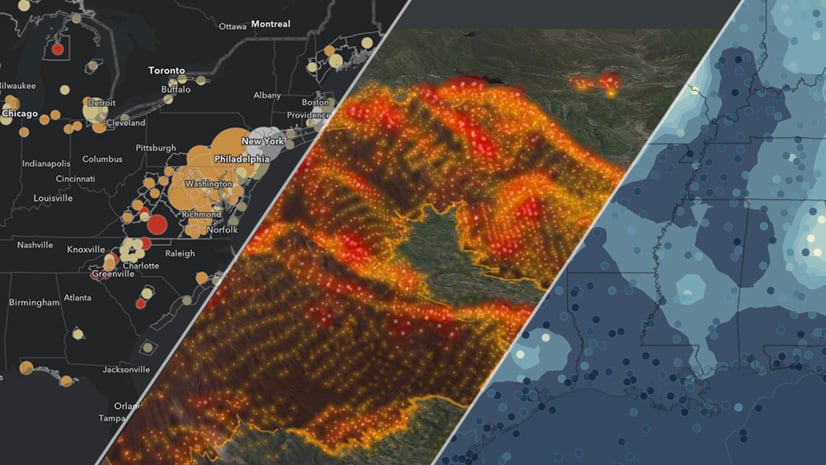
Here’s the map we’re going to build. I should note that it also uses the new hosted feature service version of our Live Feeds weather and disaster layers. Make sure you update any older maps with this new source before your older maps melt too.

OK…here we go…
Configure the Temperature
- I’ll add the layer from Living Atlas into my web map.
- Then delete the buoys layer since we’ll focus only on land areas.

- By clicking Change Style I’ll modify the layer to display Heat Feels Like and Wind Speed attributes using Counts and Amounts.
- I chose a yellow-red color ramp. Now this isn’t suggested on a dark basemap (read why) but we’ll take care of that next.
- Using the set transparency by Attribute Values settings, I use the Air Temperature to make the bright yellow colors more subtle while still having that standard “hot” color palette.

Configure the Winds
Anyone who’s experienced a 100+ day knows that the slightest breeze can make a world of difference. Unfortunately, for many years I was in DC where the air never moves. So I want to scale these circles to show areas where wind is lower as more prominent – it’ll drive the heat index point of the map.
- Back in Counts and Amounts on the Temperature layer, invert the size scale for winds.

- Copy the layer, rename it Winds, and change the symbol to just wind speed.
- In the symbols, from the Arrows menu, select the arrow that points down.
- Rotate the symbol based on the Wind Origin (degrees) and add some transparency.

Labeling the Fields
Next we’ll add in some labels. As we zoom in, we’ll display the Heat Index, Dewpoint, and Wind Speed for each location using a label offset.
- Zoom into the extent you want the labels to display. On Temperature, select Create Labels and modify the settings, using a top right offset.
- Set the Visible Range so that the label only displays at the zoom you prefer. This may take some tweaking so the map isn’t too cluttered.
- Repeat for winds using a bottom right offset.

- Lastly copy the Winds layer, rename it Dew Point, and change the symbology to Single Symbol but make it completely transparent. We only need the label from this layer. In the label settings, choose a center right offset.

There we go…we’re done. Luckily the layer comes with pre-configured pop-ups, but feel free to modify to shift the initial focus from winds to temperature and heat index.
Good luck…and stay cool!
For questions or comments, please see our GeoNet.


Commenting is not enabled for this article.