Financing in Focus for Home Improvement Projects
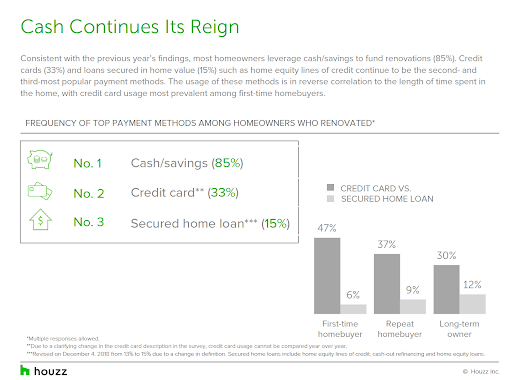
Aging housing stock, low inventory of homes for sale, and major demographic shifts are driving up demand for home improvements. In fact, 58% of homeowners on Houzz renovated their homes in 2017, at a median spend of $15,000. When it comes to funding those renovations, cash has consistently ranked as the leading form of payment, with 85% of renovating homeowners using personal savings, followed by credit card (33%) and secured home loans (15%).
That said, it is natural for consumers to look for advantageous financing methods in order to support renovation spend. We teamed up with Synchrony and Bank of America to explore the role of credit cards and secured financing, such as a home equity lines of credit (HELOC), cash-out refinancing or home equity loans, in home improvement projects.
Consumer Credit Card Spend for Home Improvement on the Rise
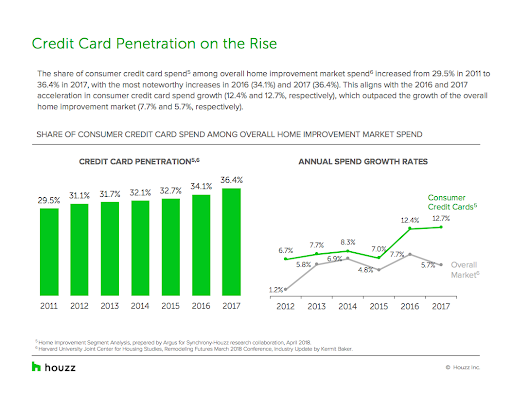
Based on our study with Synchrony, credit cards appear to be a competitive financing method for one-third of renovating homeowners, likely explaining the recent acceleration in credit usage. Consumers charged $141 billion in home improvement product and service purchases to their credit cards in 2017, a 69% increase from 2011 ($84 billion).* During 2016 and 2017, consumer credit card spend grew at near double the pace of the overall growth of the home improvement market, driving deeper market penetration.
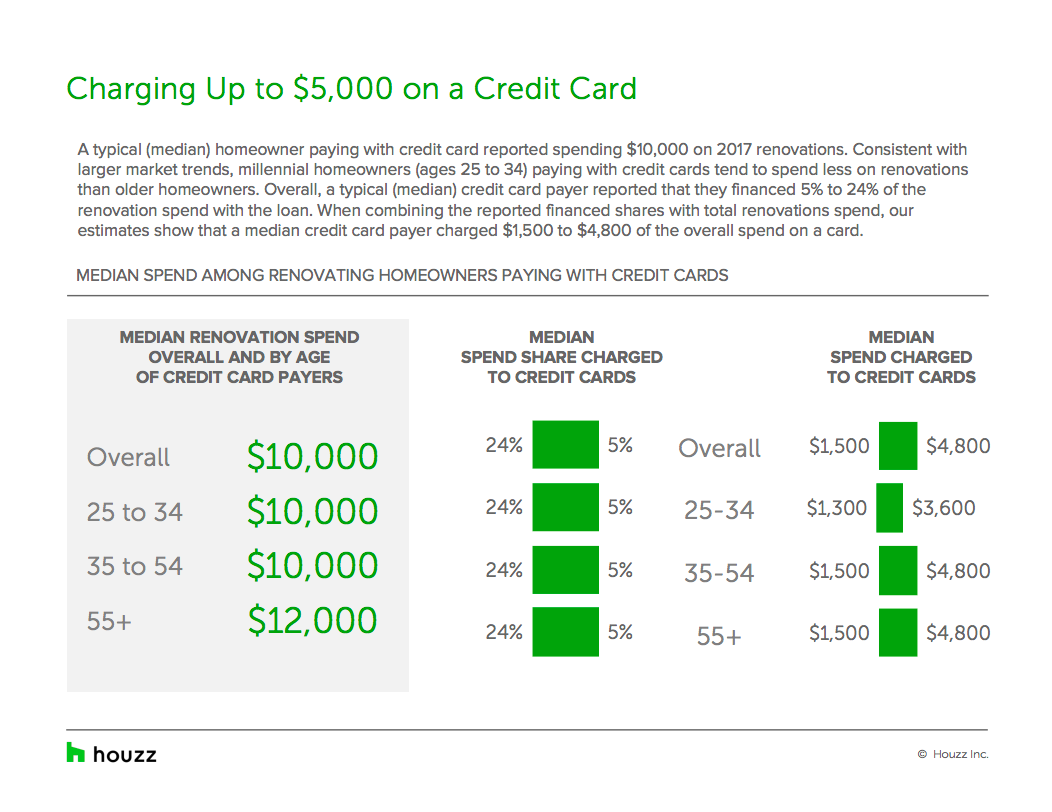
Renovating homeowners using credit card financing report a median spend of $10,000, with between $1,500 and $4,800 charged to a card. Reliance on credit cards remains high even in larger renovations, with 28% of homeowners who spent $50,000 or more on their projects paying for at least part of those renovations with credit cards.
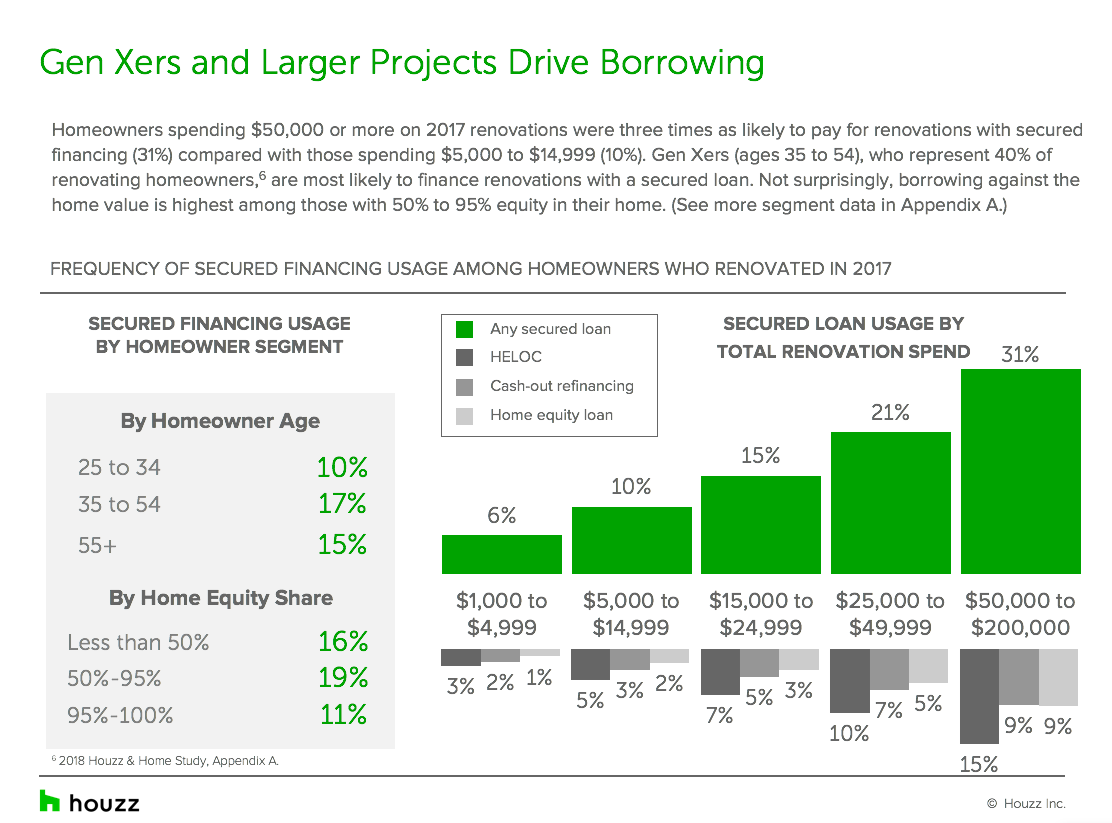
U.S Homeowners Choose Secured Financing Options for Large-Scale Home Renovations
While secured loan borrowers represent a smaller share of renovating homeowners than those who finance their projects with cash-only or with credit cards, they took on much larger home improvement projects, according to our study with Bank of America. The median spend of projects financed with secured financing were three times the median spend of those funded with cash-only or with credit cards ($32,000 versus $13,000 and $10,000, respectively).
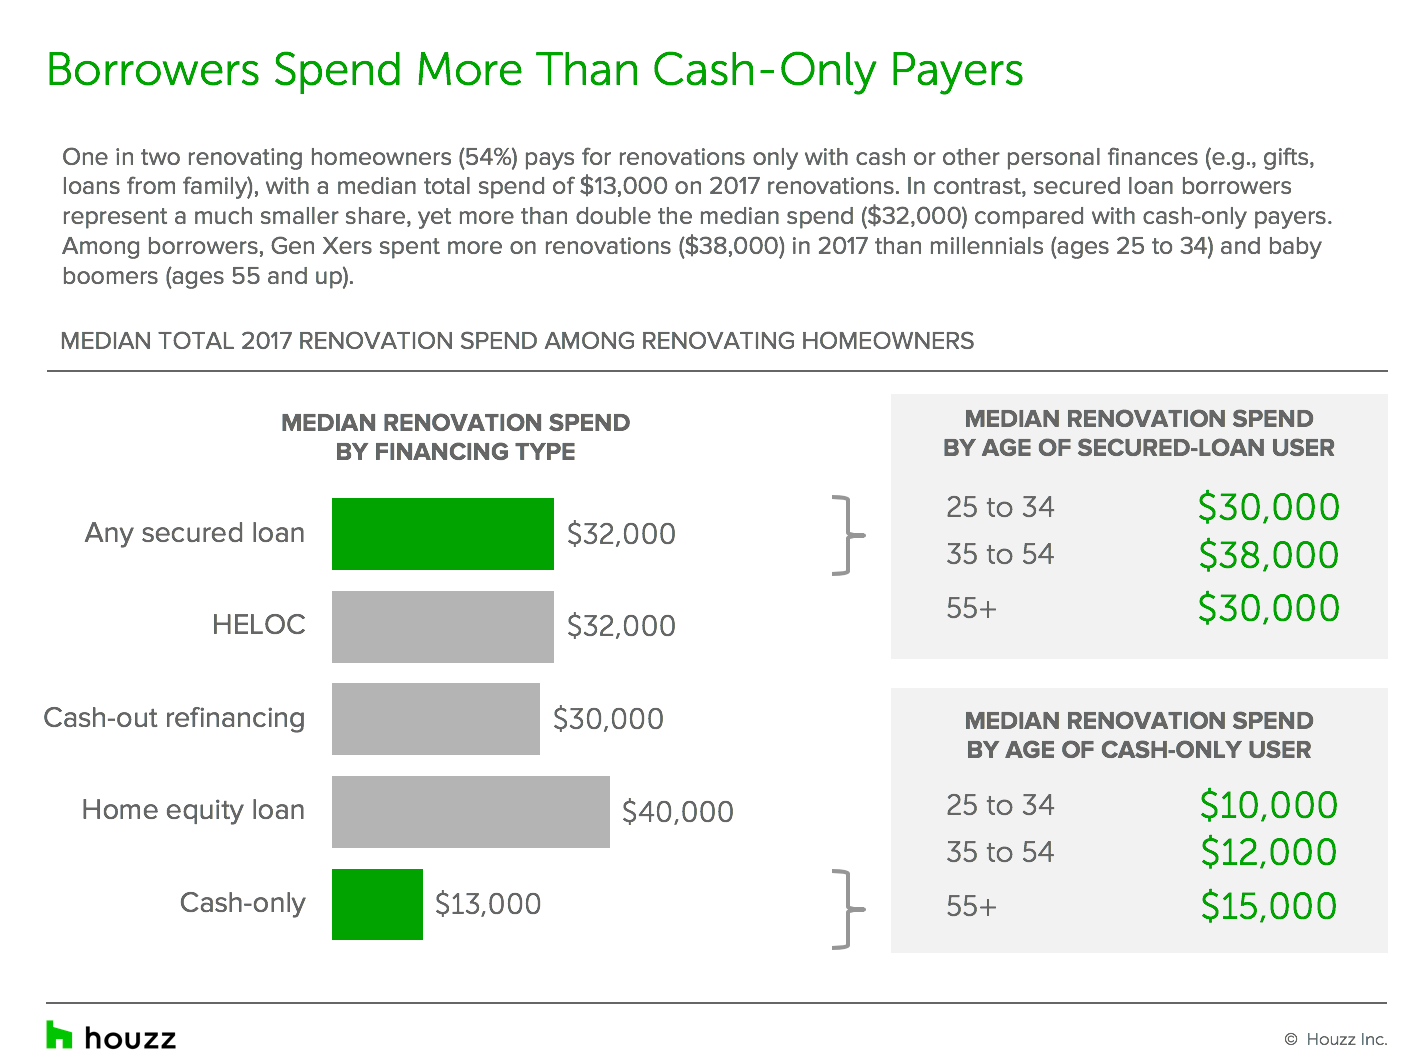
In fact, homeowners who spent $50,000 or more on renovations were three times more likely to pay with secured financing (31%) than those spending between $5,000 and $14,999 (10%).
Homeowners with mortgages, which account for 63% of all residential properties, have seen their equity more than double between 2011 and 2017, increasing by $4.9 trillion to a record-setting $8.3 trillion in 2017.** This gives homeowners greater confidence to invest in their home, continuing to spur growth in the more than $300 billion home improvement market.
Homeowners increasingly find it advantageous to stay put and renovate rather than trade up to a nicer home in an environment of tight housing inventories and higher interest rates, among other factors. It is clear from our studies that the ways homeowners fund these projects are also changing. For more information, read the credit card study here and secured financing study here.
Data for both reports was gathered from the 2018 Houzz & Home Survey
The annual Houzz & Home survey is the largest survey of residential remodeling, building and decorating activity published. The survey covers a wide range of renovation projects in 2017, from interior remodels and additions to home systems, exterior upgrades and outdoor projects. Data gathered includes historical and planned spends, professional involvement, motivations and challenges behind building, renovation and decorating projects, as well as planned activities for 2018. The 2018 study includes nearly 150,000 respondents in the U.S. alone, providing insights into the home improvement activity of the more than 40 million monthly unique users of the Houzz site and mobile apps. The Houzz & Home Survey was sent to registered users of Houzz and fielded in March-April 2018.
*Home Improvement Segment Analysis, prepared by Argus for Synchrony-Houzz research collaboration, April 2018.
**CoreLogic Home Equity Reports for 2017 Q4, 2016 Q4, 2015 Q4, 2014 Q4, 2013 Q4, 2012 Q4 and 2011 Q4. (https://www.corelogic.com/news/corelogic-reports-homeowner-equity-increased-by-908-billion-in-2017.aspx).

