It’s no surprise that today’s residential real estate has remained pricey. Rising interest rates aside, the value of most homes has gradually recovered since the last major price correction a decade ago. Gone are the days of unrestrained, unsound lending practices, and borrowers overextending themselves to the point of default or foreclosure. By and large, property values across the price spectrum have appreciated since the last recession. As this trend continues to be prevalent within markets containing premium-priced properties, we’re faced with a growing number of towns with million-dollar homes. But how many?
Show me the numbers
With over 78 million owner-occupied homes in the US:
- More than 2.1 million homes are valued between $1 million and $2 million.
- Nearly 600,000 homes are valued at $2 million or more!
- New York City tops the list with more than 68,000 homes valued at $2 million or more!
These numbers sound impressive, but million dollar plus homes represent a relatively small segment of the US housing stock. However — an interesting data discovery here is that the percentage of million-dollar properties has more than doubled since 2010.
Across the US, you can see that majority of these million-dollar plus cities are concentrated along the east and west coast regions of the US.

Where does the data come from?
Esri provides demographic data for 137 countries covering 90% of the world’s population. Esri’s in-house US Data Development team, which consists of demographers, economists, analysts, and programmers, develop independent demographic and socioeconomic updates and forecasts for the United States.
In addition to processing US Census and ACS data, the US Demographic Data Development team produces unique and innovative databases such as Tapestry Segmentation, Consumer Spending, and Market Potential which have become industry benchmarks for understanding communities. To learn more about Esri’s data accuracy, view www.esri.com/accuracy.
Why track the multi-million dollar housing market?
In most cases across the country, housing affordability continues to be a major concern. As a result, Esri’s US demographics team recognized the importance of adding more detail to the home value distribution.
“In many markets home values have surpassed their pre-recession highs. As more homes breach the million-dollar valuation mark, our home value distribution has been expanded to reflect current prices,” says Esri Chief Demographer, Kyle R. Cassal.
Show me the data
Taking a step back, if analysts wanted to identify areas with extreme affluence, the highest home value range used to be capped at $1 million or more. Capturing today’s growing multi-million-dollar housing market meant redefining and expanding Esri’s 2018 and 2023 home value ranges to offer more detailed data of owner occupied housing units with home values that would exceed $1 million. The result…
… a home value database that includes 3 new multi-million-dollar ranges:
$1,000,000-1,499,999
$1,500,000-1,999,999
$2,000,000+
A picture is worth… well, one or two million bucks!
One of the best ways to show you the impact of these new data ranges is with a map. Esri’s US demographics team created the 2017-2018 Home Value Comparison web map for the Manhattan, New York area using ArcGIS Online’s smart mapping technique called Predominance Mapping.
The panel on the left displays the predominant home value range from Esri’s 2017 home value distribution by Census tract. The top end of this distribution of owner occupied housing units is capped at $1 million or more and symbolized by the deepest purple bubbles.
The panel on the right displays Esri’s newest 2018 distribution utilizing the three new top end home value ranges. The deep red bubbles symbolize the new higher top-coded home value range.
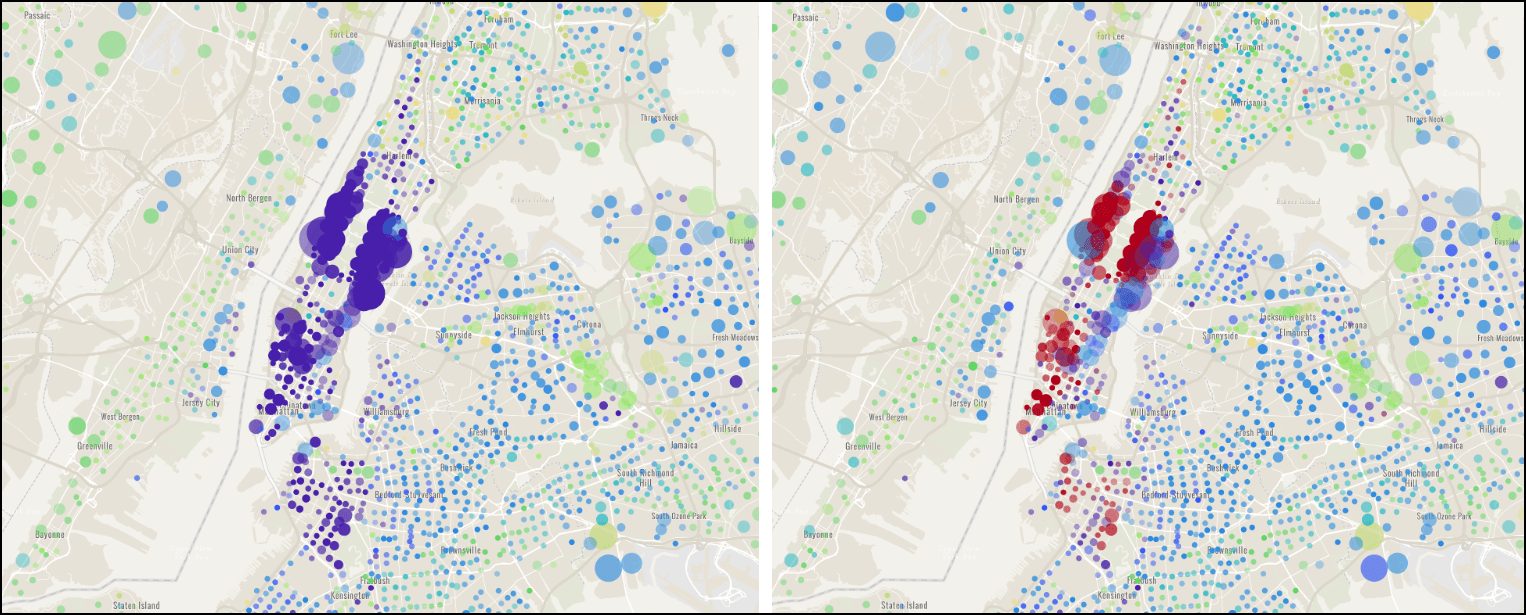
Using the predominant mapping technique, you immediately see the impact of the new intervals. Look at how the finer resolution ranges distinguish the smaller pockets of the highest valued homes at $2 million and beyond.
So, what does your town look like?
Access Esri Home Value data from these products and find out!
- Living Atlas of the World—Access ready-to-use maps.
- ArcGIS Business Analyst
- ArcGIS Community Analyst
- ArcGIS Maps for Office
- ArcGIS Maps for Power BI
- ArcGIS GeoEnrichment Service
- ArcGIS Online— Browse Living Atlas Layers and Enrich Layers
For more information about US demographics click here.


Commenting is not enabled for this article.