

Introduction: Oscilloscope in a Matchbox - Arduino


Why would I want a tiny oscillscope? I've got a room full of electronic Stuff including four oscillscopes. But it's a fuss using them. It would be nice to have something that fits in my pocket, that sits next to the circuit I'm working on and that's as easy to use as a multimeter.
This oscilloscope costs the price of an Arduino Nano (£2 and a display (£3) plus a few pence for resistors, etc. It's specification is:
- max 1M samples/second, min 1000sps
- 8-bits per sample
- DC 0-5V; AC +/- 550mV, AC +/- 117mV, AC +/- 25mV
- USB "PC scope" or built-in display
- could be battery-powered
- optional logic display
- optional frequency meter
- optional voltmeter
- optional signal generator
Mostly what I want from an oscilloscope is to know: is the signal present? Roughly how big is it? And roughly what's its frequency? It's not often I really need all the bells and whistles of a proper bench oscilloscope.
How well does it work? At lower sample rates it's quite reasonable. But at 1M samples/second it's pretty poor. You can see that there's a signal and see its frequency but the y-axis is quite crude.You should only really use it for audio (to 20kHz) in the analogue mode but 1Msps works well in Logic mode. After all, it's just an Arduino Nano so it "is like a dog's walking on his hind legs. It is not done well; but you are surprised to find it done at all".
A couple of years ago, I made a "development station" - a plastic box with a solderless-breadboard on the top and a USB-serial converter, PIC programmer, voltmeter and logic analyser inside. My "workbench" has shrunk from several square metres to 15cm square. It now also has its own oscilloscope. I'll publish an Instructable for the "development station" real soon now.
Step 1: Sampling at 1M Samples Per Second

Let's call this oscilloscope "ArdOsc" (because that's the name of the INO file).
Six years ago Cristiano Lino Fontana published an Instructable for his Girino design.
It sort-of works but has problems. In particular, its maximum reliable sample rate is around 37ksps (at 75ksps it occasionally freezes) and the trigger doesn't seem to work properly. It also doesn't have a display.
The Girino is slow because it uses interrupts. Interrupts are slow because of the code needed to save and restore registers. Interrupts are dangerous because they can result in flaky software with errors that occur only rarely. I've been writing embedded code for 40 years and I avoid interrupts whenever I can. Polling Good, Interrupts Bad. Heed My Words.
So ArdOsc disables all interrupts, goes into a tight loop and grabs the data from the ADC when it wants it. If the ADC hasn't finished: too bad - just give me what you've got. It grabs 1000 samples (one byte each), then re-enables interrupts and sends the bytes to the PC through the serial port at 115200 baud - or it grabs 128 samples and displays them on its screen.
The Girino Instructable describes the Arduino ADC in huge detail. If you're interested, read it and read the Atmega328p datasheet. I'm just going to tell you the outline.
The Arduino ADC uses "successive approximation". It measures the most significant bit - is it 0 or 1? Having got that, it then compares its "answer so far" with the input voltage and measures the next most significant bit. Then the next. And so on for 10 bits. The bits are stored in the ADCH register (first 8 bits) and ADCL (next two bits. I only want 8 bits so I ignore ADCL.
The ADC sets a flag when it's measured all 10 bits. But I only want 8 bits so I ignore the flag and read ADCH whether the ADC is finished or not. I originally thought that meant I would get the "answer so far" but I don't. The "answer so far" is stored somewhere else and all we get is the last answer uploaded to ADCH. That means that in the 1Msps mode, every successive set of 4 samples are identical. The Arduino sketch smooths them so they look good but don't be fooled: you're seeing 250ksps. (Thank you to AndrewJ177 for pointing that out - see discussion below.)
It takes time to measure each bit. That timing pulse comes from dividing the Atmega's clock (16MHz) by a "prescaler" value: 2, 4, 8, 16, 32, 64 or 128. If you set the prescaler to 2, that's 0.125uS which is too short for the ADC to do its comparison properly - it's very poor quality. Prescaler=4, means 0.25uS which kind-of works - the result is noisy. Prescaler=8, means 0.5uS which is pretty reasonable for 8-bits. In general, the longer you give the ADC per bit, the better it works.
But if you allow the ADC, say, 1uS per bit then it's going to take 8uS per byte which is 125ksps - rather slow. If you set the prescaler too low, you'll only get the top few bits converted properly and the resulting graph has big jagged steps. If you set the prescaler too high then you'll have to wait a long time for the conversion.
So it's a trade-off between time per bit and samples per second.
We must also consider how long it takes for the input signal to change the voltage in the sample-and-hold capacitor of the ADC. We're not changing channel before each conversion so the charge time dosn't have to be as long as the Atmel documentation suggests but there is still an effect. The oscilloscope is decent up to 20kHz but then the response rolls-off. You can see a 50kHz sine wave but is a quarter the size it should be.
The ArdOsc code just has a loop that is exactly the right length to sample at 1Msps - i.e. it takes 16 clock cycles round the loop. Another more complicated loop does longer sample times.
Step 2: The Simplest Oscilloscope


The simplest ArdOsc consists of an Arduino Nano (328p 16MHz) 4 resistors and 3 capacitors.
The oscilloscope is powered from a USB connection and transmits frames of data to the PC via USB.
The input signal is fed into the ADC A0 pin. A 10k resistor provides some protection to the Atmega in case of extreme voltages. Atmega pins have diodes that prevent their input going above Vcc (5V) or below 0V. The diodes can conduct up to 1mA so the input signal of the oscilloscope can safely vary between -10V and +15V. The input impedance of the the ADC pin is around 100M and 14pF so the additional 10k has little effect on the accuracy of the ADC.
The A0 pin voltage is read by the ADC using Vcc as a reference voltage - so the measurement is from 0V to 5V. (Actually it's 0 to Vcc*254/255.) Unfortunately, Vcc is rarely exactly 5V so the program reads the actual value of Vcc and draws the graticule of the "oscilloscope display" appropriately.
The input is also fed through a 100nF capacitor and into the ADC A1 pin. A1 is connected to 0.55V through a 1M resistor. The A1 pin therefore sees the AC component of the input signal centred on 0.55V.
The A1 pin voltage is read by the ADC using the internal 1.1V reference voltage - so the measurement is from -0.55V to +0.55V.
The 0.55V is generated with a potential divider from the 3V3 pin of the Nano. The 3V3 pin voltage is a lot more stable that the "5V" from a USB connection. The output from the 3V3 pin is not exactly 3.3V so you'll have to trim the potential divider to give 0.55V. Connect the oscilloscope input to ground and see what "voltage" the AC range displays. Adjust R1 until the line is in the centre of the screen - I needed R1=33k.
I've shown a stripboard layout for the circuit. The stripboard is the same size as the Arduino Nano and they form a sandwich. The Nano's underside is next to the copper side of the stripboard (so in the diagram, the Nano is shown from underneath). Solder some pins onto the stripboard then fit the Nano over the pins and solder them to the Nano. In my diagram, the copper of the stripboard is shown in cyan. Red lines are wire links on the stripboard or flexible wires going off the board for signals and power.


Step 3: Amplifying the Signal


The "Simplest" oscilloscope has two input ranges:
- 0V to 5V
- -0.55V to +0.55V
but many signals we're interested in are smaller than that. So we can add two stages of amplification.
An LM358 dual op-amp amplifies the AC signal at A1. The op-amps are AC-coupled and both inputs are centred around 0.55V. Both op-amp stages have a gain of just under 5x. Their outputs go to A2 and A3 so the Atmega can choose which signal to sample.
The oscilloscope now has four input ranges:
- 0V to 5V
- -0.55V to +0.55V
- -117mV to +117mV
- -25mV to +25mV
It uses the same INO file and exe as the "Simplest".
The advantage of centering the AC signal around 0.55V is that the op-amp signal stays low. The LM358 output cannot go within 1.5V of Vcc; so it's range is 0V to 3.5V - dreadful.
I've shown a stripboard layout for the circuit. There are two stripboards - one for the Nano and one for the LM358. They should form a sandwich. The boards are shown from the component side. Fine flexible wires join the two boards. Attach the boards together with sticky pads, soldered stand-offs, or whatever. In my diagram, the copper of the stripboard is shown in cyan. Red lines are wire links on the stripboard or flexible wires joining the boards together. I haven't shown the "test leads".
Once again, you might have to trim the potential divider to give 0.55V. Connect the oscilloscope input to ground and adjust R9 until the line is in the centre of the screen - I needed R9=33k.
There can be a problem with the LM358. If the signal is bigger than the LM358 can handle the output of the LM358 is distorted. You should be using the higher-gain settings to look at small signals. If you use them on big signals they'll get distorted. You could try a better chip if you've got one - the LM358 is a rather poor chip.
Step 4: Logic Display

Often you're dealing with logic levels - could the oscilloscope show a few channels of "logic". Yes - and it's a lot easier than messing about with the ADC.
Is it worth it? Probably not but it's easy to do so why not?
The oscilloscope now has five input ranges:
- 0V to 5V
- -0.55V to +0.55V
- -117mV to +117mV
- -25mV to +25mV
- Logic
In the "Logic" mode, four channels of logic can be connected to Arduino pins D8, D9, D10 and D11. They are shown as four lines on the display.
D8 to D11 correspond to the Atmega328p chip's Port-B pins 0 to 3. The chip reads the whole of Port B into its sample buffer rather than the ADC output in the ADCH register.
In the 1Msps mode, the theoretical maximum frequency you'll be able to see is 500kHz - but all you'll get is a solid bar of "state changes". In practice a 250kHz signal is easier to see.
If you don't want the "logic" input then don't include the connectors to D8 to D11. In the INO file, set the bool constant bHasLogic to false. (I tried rewiting the code to use a #define rather than a bool const but it was a mess.)
Step 5: The Trigger

Let's say you're looking at a repetitive waveform, for instance a sine wave. It's nice if the oscilloscope shows it in the same place on the screen for every sweep. So the oscilloscope sweep should be triggered to start just as, say, the wave goes from negative to positive.
At first I tried to use the comparator to trigger the sweep (i.e. starting to collect data) as the Girino does. It seems ideal but turns out to have disadvantages. I decided on a fixed trigger voltage of 0.55V - the middle of the AC signal. The Atmel allows you to connect the comparator to the current ADC channel. Sounds good. But you have to turn off the ADC and, when the trigger occurs, turn it back on again. It takes a while for the ADC to start up. Not so good.
So I take the simple way out - run the ADC and watch the values it produces. When they go from under half-way to over half-way, start the sweep.
In "Logic" mode, D8 is used as the trigger.
If there's no signal then the oscilloscope ought to free-run. To start a sweep after after it's waited a while. I chose a maximum wait of 250mS. The program initialises Timer1 (a 16-bit timer) then waits until it has counted a sufficient number of ticks. I simply watch the Timer1's counter - there ought to be a better way of doing it with flags but it's hugely complicated and I couldn't get it to work 100% reliably.
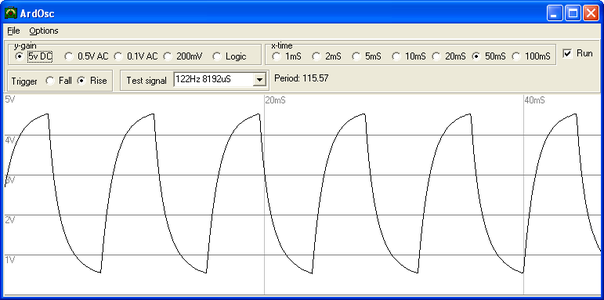
Step 6: Test Signal Output

You occasionally need a signal to test whatever circuit you're building. Many people will already have a signal generator.
The ArdOsc circuit can provide a square wave at the following frequencies:
- 31250/1 = 31250Hz
- 31250/8 = 3906Hz
- 31250/32 = 977Hz
- 31250/64 = 488Hz
- 31250/128 = 244Hz
- 31250/256 = 122Hz
- 31250/1024 = 31Hz
The test signal is generated on pin D3.
If you don't want the "test signal" output then don't include the connectors to D3. In the INO file, set the bool constant bHasTestSignal to false.
Step 7: Serial Protocol

The oscilloscope transmits frames of data to the PC via the USB cable as though it were a serial data stream at 115200 baud, 8-bits, no parity.
The PC can send the two kinds of commands to the oscilloscope. Lower case commands are single bytes:
- 'a' set x-axis to "1mS" = 1Msps
- 'b' set x-axis to "2mS"
- 'c' set x-axis to "5mS"
- 'd' set x-axis to "10mS"
- 'e' set x-axis to "20mS"
- 'f' set x-axis to "50mS"
- 'g' set x-axis to "100mS"
- 'j' set y-axis to 5V
- 'k' set y-axis to 0.5V
- 'l' set y-axis to 0.1V 'm' set y-axis to 200mV
- 'n' set mode to "Logic"
- 'p' set trigger to Falling
- 'q' set trigger to Rising
- 'r' set test signal Off
- 's' set test signal 31250Hz
- 't' set test signal 3906Hz
- 'u' set test signal 976Hz
- 'v' set test signal 488Hz
- 'w' set test signal 244Hz
- 'x' set test signal 122Hz
- 'y' set test signal 30Hz
- 'z' sweep and send data
The data from a sweep is sent as:
- 0xAA
- 0xBB
- 0xCC
- 1000 bytes of data
The program responds to every command by transmitting an Ack byte - "@".
The Arduino Serial library uses interrupts to read the serial input. Inputs are turned off during a sweep so the incoming byte remains in the Atmega's serial input register. When the sweep ends, the Serial library collects the byte and the program can read it. But if a second byte arrives during a sweep, it will be discarded.
Upper case commands can contain several bytes so can get corrupted if sent during a sweep. Stop sending 'z' and wait for the result before sending an upper case commands. Upper case commands are only used for debugging and testing. Several can containg an integer decimal value 'n':
- 'A'n set ADC channel to n
- 'B' report "battery" voltage = Vcc
- 'D' report status
- 'F'n set frequency of pwm
- 'R'n set Vref for ADC
- 'T'n trigger rising or falling
- 'U'n set prescaler and send sweep data
- 'V'n set sample period for ADC
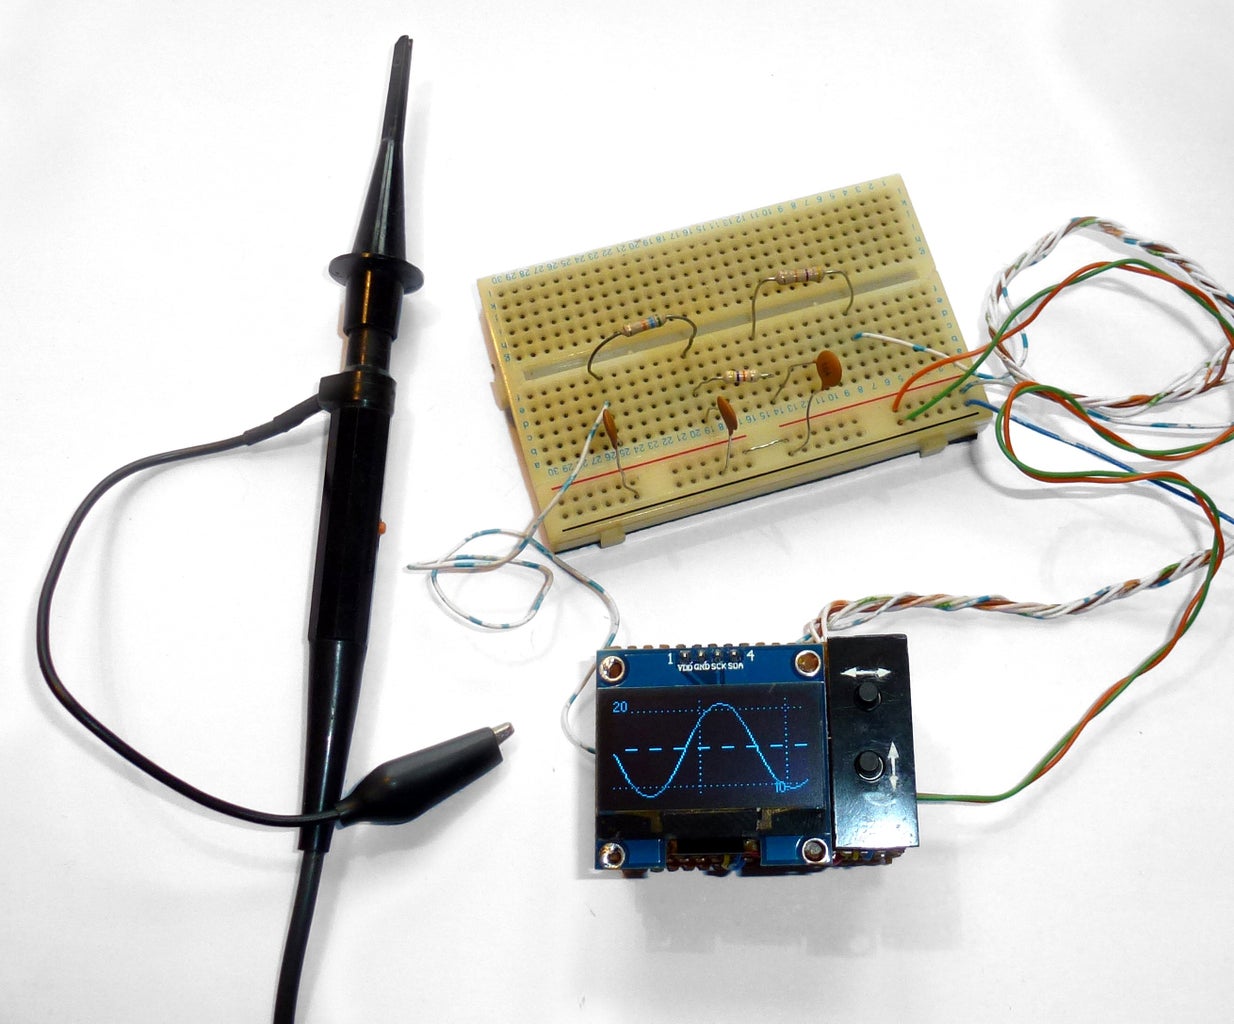
Step 8: Adding a Display


The oscilloscope can have its own buil-in display - a 1.3" OLED. Although 1.3" sounds small, these displays are very legible.
The display has a 1.3" OLE running at 3.3V which is controlled by an SH1106 chip via an I2C bus. (SPI versions are available but I'm using the Arduino SPI pins for "logic".)
I needed a very fast Arduino library and it should preferably be small. The U8glib library is slow and huge so I wrote my own. It has very few commands so it is called "SimpleSH1106".
The SH1106 has a built-in buffer with one bit per pixel. It is arranged as 128 columns by 7 swathes (other sizes are available). Each swathe is 8 pixels high with the lsb at the top. In the SH1106 documentation, swathes are called "pages" but "swathe" is the standard term in computer graphics. The smallest unit you can write is one byte - a column of 8 pixels starting on an 8-pixel boundary.
My library has no screen buffer on the Arduino so all the commands are based on writing whole bytes to pages. It's less convenient but you gain 1k of RAM.
The Atmel328p has a built in I2C driverconnected to pins A4 (SDA) and A5 (SCL). SDA and SCL need pull-up resistors; the built-in I2C driver uses the Atmel328p weak pull-ups of around 50kohm. The 50k pull-ups work at low speed but the rising edges are not fast enough for high-speed so I've added 1k pull-ups to the 3V3 pin of the Nano.
The Arduino IDE has an I2C driver library called Wire.h. It's a nice small fast library but, as you would expect with Arduino, is poorly documented. The library initialises the I2C hardware to run at 100kHz but I wanted faster. So after calling Wire.begin(), I set the Atmel328p TWBR register to a smaller value.
The resulting library is fast - the sweep display of the oscilloscope is drawn in 40mS. The following commands are available:
- void clearSH1106() fills the screen with 0 bytes (black).
- void DrawByteSH1106 draws a single byte (a column of 8 pixels).
- int DrawImageSH1106 draws an image.
- int DrawCharSH1106 draws a character.
- int DrawStringSH1106 draws a string.
- int DrawIntSH1106 draws an integer.
Images are declared in program memory (PROGMEM). A Windows program is provided to convert a BMP file into a run-length-encoded image for SimpleSH1106.
A full description is given with the library.
I've shown a stripboard layout for the circuit. There are three stripboards - one for the Nano, one for the display and one for the LM358. They should form a sandwich. The boards are shown from the component side. Fine flexible wires join the two boards. Attach the boards together with soldered stand-offs. In my diagram, the copper of the stripboard is shown in cyan. Red lines are wire links on the stripboard or flexible wires joining the boards together. I haven't shown the "test leads".
Some displays seem to have the pins in a different order. Check them.
The x-coordinate of the pixels of the 0.9" display I bought run from x=0 to 127. With the 1.3" display they're from x=2 to 129. The library contains a constant "colOffset" which allows you to adjust the offset for your display.
I have attached Gerber files and EasyPC source files for an SM PCB. These have not been tested so use them at your own risk.
Step 9: Different Screens


The analogue display shows the waveform with a graticule. The horizontal axis shows the time im mS. The vertical axis shows Volts with dotted lines drawn for 4V, 0.5V, 0.1V and 20mV; in the DC mode, 0V is at the bottom; in the AC mode, 0V is in the middle shown as a dashed line.
The logic display shows four channels of bits. D8 is the top channel and D11 is the bottom. The horizontal axis shows the time in mS.
There are two pushbuttons: a "Horizontal" button to adjust Timebase axis and a "Vertical" button to adjust the Gain axis. If you hold either button down for 1 second then a menu screen appears.
When the menu is showing, the "Vertical" button scrolls through the different settings and the "Horizontal" button sets the value for each setting. If you don't press either button for 2 seconds, the program goes back to showing the waveform.
Step 10: Frequency Counter


ArdOsc can also act as a frequency counter by using uses Timer1 and Timer2. There are two ways a frequency counter can work: count the number of rising edges in exactly one second or measure the time from one rising edge to the next rising edge.
Once again, is it worth it? Maybe. I can't remember a time I've needed a frequency counter. It's easy to do so why not?
To count the edges of the "logic" signal at D8, the program selects D5 as the clock input of Timer1 (a 16-bit counter/timer). D5 is externally connected to D8 - one of the "logic" inputs. Timer0 (an 8-bit timer) is set to overflow once every milliSecond. Each time Timer0 overflows, it causes an interrupt. After 1000 interrupts, the count in Timer1 is displayed as the "frequency". If the Timer1 count exceeds 65536, it causes an interrupt and the number of such interrupts is noted.
To measure the time from one edge to the next of the AC signal, Timer 1 is set up as a free-running 16MHz timer. The ICR1 register is set to capture the current value in Timer1 whenever the comparator goes high. The negative input of the comparator is connected to A3 and the positive input is connected to D6. Each time the comparator goes high, it causes an interrupt. The time between one interrupt and the next is the period (1/frequency). The program displays the average frequency measured over one second. The comparator is meant to trigger on a rising edge but it has no hyteresis so if there is noise, a falling edge will be seen as a rising edge. This is particularly important at low frequencies so, for instance, a 10Hz signal will ofetn be reported as 20Hz.
Meanwhile, Timer2 might be producing the "test signal". So there are no timers free and we cannot use the normal Arduino functions delay(), millis(), etc.
The code for the frequency counter is based on the excellent web page by Nick Gammon.
If you don't want the "frequency counter" input then you don't need the connection from D5 to D8. In the INO file, set the bool constant bHasFreq to false.
Attachments
Step 11: Voltmeter
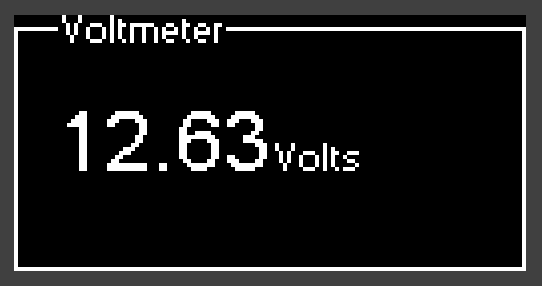

The oscilloscope can also act as a voltmeter which can measure between approximately -20V and +20V. It uses the built-in bandgap voltage-reference of the Atmega328p so is fairly accurate.
Is it worth it? The number of features is getting ridiculous. OK, why not?
The voltage is measured at A6 and the ADC uses Vcc (i.e. approximately 5V) as its reference. Because "5V" is approximate, we also measure the actual value of Vcc by comparing it with the 1.1V bandgap.According to the datasheet, the bandgap is only 10% accurate but the few I tried are close to 1.1V.
The incoming voltage that you want to measure goes through the resistor network. I've chosen the values shown above
- Ra=120k
- Rb=150k
- Rc=470k
You'll find those constants near the beginning of the MeasureVoltage() function.
Rc tells you the input impedance of the voltmeter. 470k is low compared with a cheap digital multimeter but is high enough to be useful.
The lowest voltage that the voltmeter can measure is
-5*Rc/Ra = -19.6V
The highest it can measure is
5*Rc/Rb+5 = 20.7V
You can choose different resistors if you want.
What if you exceed those voltages? It will be fine. If the voltage at an input pin of the Arduino goes above Vcc or below 0V, the protection diodes can survive a 1mA current. With a 470k that means you could, in theory, have a test voltage of 470V. But I wouldn't trust the insulation of the stripboard at 470V and you shouldn't be playing with voltages like that and a circuit this crude.
You'll need to calibrate the voltmeter if want accurate measurements. Connect the voltmeter input "probe" to 0V and see what the the Voltmeter reports. Adjust the calibrateZero constant until the Voltmeter reads "0.00V". Now connect the voltmeter input to a known voltage source - if you have a decent multimeter then measure the voltage of a 9V battery. Adjust the calibrateVolts constant until the Voltmeter gives the right answer.
If you don't want the "voltmeter" input then you don't need the resistors connected to D6. In the INO file, set the bool constant bHasVoltmeter to false.
Step 12: Test Leads
Oscilloscopes usually have fancy test leads. I am generally using a solderless breadboard so I just attached the sort of plug-in wires one uses with a breadboard. As the oscilloscope is powered from 5V, I connect it to whatever 5V and 0V supply I'm using on the breadboard with more plug-in wires.
Step 13: Add a Signal Generator


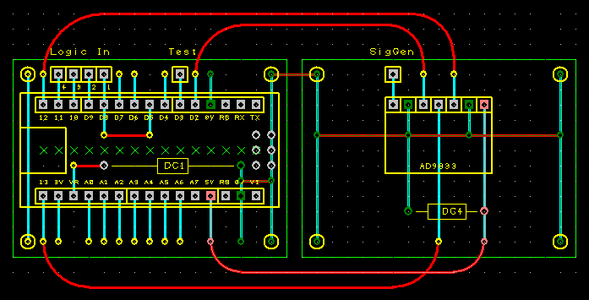
A signal generator is a very useful piece of test gear. This one uses an AD9833 module. I've decribed a stand-alone version here; this step describes how to add one to to ArdOsc. (This Step is an edit to this original Instructable.)
The AD9833 can gererate sine, triangle and square waves from 0.1 MHz to 12.5 MHz - the software in this project is limited to 1Hz to 100kHz. It can be used as a sweep generator. Sweep generators help test the frequency response of filters, amplifiers and so on.
The AD9833 module I chose is similar to this one. I'm not saying that's the best or cheapest supplier but you should buy one that looks like that photo.
The connections between the modules are:
- grounds connected together
- 5V = Vcc of AD9833
- D2 = FSync
- D13 = Clk
- D12 = Data
The schematic above is in addition to the schematic in Step 8. You can use another piece of stripboard to add another layer to the sandwich described in Step 8.
I've updated the INO file in Step 8 to include code to control the AD9833. If you add an AD9833, you should set the bHasSigGen variable to true (I have left it as false as most people won't have an AD9833).
A new menu controls the AD9833. It allows you to select the frequency and the waveform and whether the frequency is being swept.
The sweep generator repeatedly outputs a gradually increasing frequency over over 1, 5 or 20 seconds. It starts at "min" frequency and 1, 5 or 20 seconds later is at "max" frequency. The frequency change is logarithmic and it is changed every milliSecond. While the frequency is being swept, the oscilloscope cannot display it.
In a different mode, the sweep generator outputs a frequency, displays the oscilloscope input, changes the frequency, displays the oscilloscope input and so on. The frequency changes from "min" to "max" over 20, 100 or 500 of these steps (or "frames" as I've called them). The frequency changes are cruder than in the "sweep" mode but you can watch what's going on.
Step 14: Future Developments
Could it be battery powered? Yes, just add a 9V PP3 connected to the RAW pin of the Nano. It typically uses 25mA.
Could it be powered by a single lithium cell? That's not so straightforward as 3.7V may not be enough. The code that displays voltages in DC mode already reads the Vcc voltage so it will adjust the graticule position. The Nano can run on 3.7V (into the "5V" pin). However, the 3V3 output will probably not be at 3.3V; the drop-out of the regulator is too big. You could run the display straight off the 3.7V of the lithium cell but then where do you get the 0.55V reference voltage from? It needs to be stable. Perhaps you could use an LM317 (which gives a stable 1.25V if you connect its Adjust pin to 0V - the drop-out should be low enough at that current). Or you could use an LED as a zener. Or the voltage at the Vref pin can be used so long as you draw a tiny current - connect it to an emitter-follower. You may need to replace the LM358 with an op-amp that works at a lower voltage.
Could the trigger be better? Digital oscilloscopes collect data before the trigger into a circular buffer. Could the trigger level be variable? Could you have single sweep? Yes, you could do all of those but you'd probably be better just buying a "proper" oscilloscope.
Could you use a Pro Mini? Yes but it's not worth it. You will need to make your own 3V3 signal for the display and for the 0.55V reference voltage. If you're sending the data to a PC then you'll need a serial-to-USB converter. Just use a Nano.
Could it be wireless? Yes. Add you own bluetooth with an HC-05 (Instructables are available) and connect to a PC or Android phone. An ESP 8266 would be more trouble that it's worth for this project.
Could you use a bigger display? Yes but why bother, the quality isn't that good. Just buy an oscilloscope.
Can you do better than an LM358? Yes. If you have a variety of op-amps in your component drawer, try them out. Let me know which one works best.


