Indiana's elderly population projected to climb sharply

The number of Hoosiers over the age of 80 will more than double in the coming decades.
By 2030, one out of every five people living in Indiana will be a senior citizen (ages 65 and older), according to population projections released by the Indiana Business Research Center.1 More than 966,000 senior citizens called Indiana home as of 2015 (the base of the population projections). That number is expected to grow 46 percent by 2030 to exceed 1.4 million (see Figure 1). By 2050, the number of people ages 65 and older will top 1.5 million—a growth of 57 percent from 2015 levels.
Figure 1: Indiana’s projected senior citizen population

Source: Indiana Business Research Center
What’s more, the elderly population ages 80 and older is expected to grow even more rapidly in percentage terms, increasing by 121 percent by 2050 (see Table 1).
Table 1: Projected growth in Indiana’s senior citizen and elderly populations
| Year | Senior citizens (65+) | Elderly (80+) | ||||
|---|---|---|---|---|---|---|
| Population | Change since 2015 | Percent change since 2015 | Population | Change since 2015 | Percent change since 2015 | |
| 2015 | 966,124 | n/a | n/a | 244,876 | n/a | n/a |
| 2030 | 1,412,196 | 446,072 | 46% | 358,826 | 113,950 | 47% |
| 2050 | 1,518,607 | 552,483 | 57% | 541,623 | 296,747 | 121% |
Source: Indiana Business Research Center
This will be an unprecedented number of elderly in the state. Looking back over time, Figure 2 shows that the population ages 80 and older increased from about 97,000 in 1970 (2 percent of the total population) to nearly 250,000 in 2017 (4 percent of the total population). Keep in mind, though, that average life expectancy in the U.S. has steadily increased from 70.8 years of age in 1970 to reach 78.7 years by 2016.2
By 2030, the 80-and-older age group is expected to reach 5 percent of the total population and continue advancing to 7 percent of the population by 2040 (where it will stay for the remainder of the projections period).
Figure 2: Indiana’s senior citizen population by age group over time

Note: Data for 1980 were not accessible. Data for 2010-2017 come from the 2017 vintage of the population estimates.
Source: U.S. Census Bureau
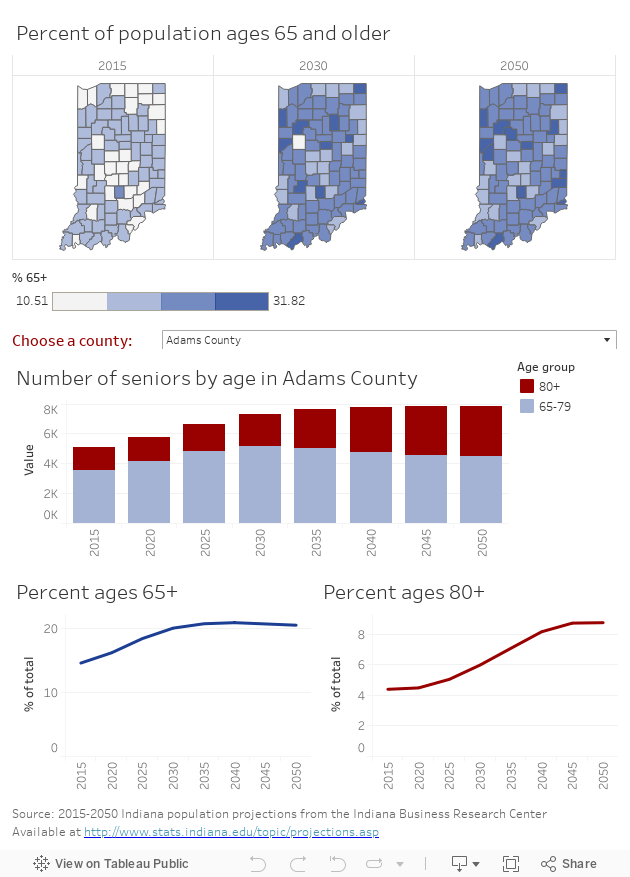
Within the state, some counties will experience more growth in this demographic than others. Three counties in the Indianapolis area (Hamilton, Hendricks and Boone) are expected to see increases in the 65-and-older group exceeding 140 percent between 2015 and 2050. Just two counties (Blackford and Grant) are expected to experience declines in this group. But even those two counties that have declines for the broader senior citizens cohort are expected to experience at least 30 percent growth in the number of residents ages 80 and older. Topping the list for 80-and-older cohort growth are Hamilton, Hendricks, Switzerland, Dearborn and Hancock counties—each with an increase exceeding 200 percent between 2015 and 2050. Use Figure 3 to further explore the data for any Indiana county.
Figure 3: Senior citizen county-level projections
One must be careful that discussions of an aging population do not automatically frame this as a “problem.” For starters, from a personal perspective, isn’t living to “a ripe old age” the goal? While we by no means want to insinuate that “if you’re no longer working, you’ve lost the main value that society places on you,”3 this publication does focus on the workforce—and an increasingly aging population will carry implications on that front.
Labor markets
In a prior article, we noted that one out of three Indiana counties lost population in every age group except for the 65-and-older group between 2010 and 2016, and another third of the state’s counties lost population in four of the six age groups.4 In the absence of increased migration, many Indiana communities may have cause for concern in terms of having enough available workers as more and more baby boomers leave the workforce.
The flip side of this is that a tight labor market might provide more economic opportunities for baby boomers who desire (or need) to keep working past typical retirement age.5 In recent years, we have seen a slight increase in the percentage of people working past 65. As of 2017, 16.2 percent of the 65-and-older crowd in Indiana worked, an increase of 1.5 percentage points relative to 2013 (see Table 2).
Table 2: Percent of senior citizens who work in Indiana
| Year | Workers (ages 65+) | Total 65+ population | Workers (ages 65+) as a percent of total 65+ population |
|---|---|---|---|
| 2013 | 134,739 | 914,620 | 14.7% |
| 2014 | 140,895 | 941,824 | 15.0% |
| 2015 | 148,631 | 966,567 | 15.4% |
| 2016 | 158,499 | 994,707 | 15.9% |
| 2017 | 165,881 | 1,024,890 | 16.2% |
Note: In the 2017 vintage of the population estimates released in June 2018, the Census Bureau revised data for all years back to 2010, which is why the 2015 number shown here is slightly higher than the 2015 number used as the base for the projections and referenced elsewhere in this article.
Source: Quarterly Workforce Indicators (employment) and 2017 vintage population estimates (total population) from the U.S. Census Bureau
Social Security
An increase in the number of workers over 65 doesn’t mean that seniors are signing up to receive Social Security payments any later. They are not. This would be in line with research showing that baby boomers have insufficient retirement savings,6 and that unstable or low-wage jobs make up more than half of older workers’ job growth.7
SmartAsset estimates that the average retirement age in Indiana was 63 in 2016 (the same as in the U.S. overall).8 Indeed, national data from the Social Security Administration show that over half of retirees in 2016 began receiving benefits before their full retirement age (see Figure 4).
Figure 4: Percent of U.S. Social Security recipients by age at entitlement, 2016

Source: 2017 Annual Statistical Supplement from the U.S. Social Security Administration
Looking ahead
Of course, Indiana and the U.S. are not alone in this demographic trend of an aging population. Globally, we see multiple countries that already have 20 percent of their population over the age of 65—a number that Indiana as a whole is not expected to reach for another decade (see Figure 5).9
Figure 5: Nations with high percentages of senior citizens, 2016
The population projections discussed in this article estimate that Indiana’s population over 80 years old will more than double by 2050. How will this change society? Is there a chance that “80 will be the new 60?”10 How will quality of life change for seniors and their families if the risk of outliving their savings becomes more real and reliance on Social Security and other safety net programs increases? And how will the broader economy be impacted if 40 percent of older workers experience downward mobility in retirement and fall into poverty or near poverty as some research has suggested?11 These are all questions worth serious exploration as we look to the future.
About the Projections
These population projections rely exclusively on the history of birth, death and migration trends for the state and each county. Therefore, these figures reflect what Indiana and its communities will look like if past conditions persist. No assumptions have been made about future economic or environmental conditions. Also, population dynamics (particularly migration) can be difficult to predict. For this reason, the projections are updated every five years.
Access more data and maps from the state's official population projections (available for counties, metros, regions and statewide) on STATS Indiana at www.stats.indiana.edu/topic/projections.asp.
Notes
- Matt Kinghorn, “Indiana Population Projections to 2050,” InContext, March-April 2018, www.incontext.indiana.edu/2018/mar-apr/article1.asp.
- “Life Expectancy at Birth, Total (Years),” The World Bank, https://data.worldbank.org/indicator/SP.DYN.LE00.IN?end=2016&locations=US&start=1970.
- Judy Lin, “Honor or Abandon: Societies’ Treatment of Elderly Intrigues Scholar,” UCLA Newsroom, January 7, 2010, http://newsroom.ucla.edu/stories/jared-diamond-on-aging-150571.
- Rachel Strange, “Indiana’s Changing Age Mosaic,” InContext, November-December 2017, www.incontext.indiana.edu/2017/nov-dec/article1.asp.
- Geoff Williams, “What Happens If We All Run Out of Money for Retirement?” U.S. News & World Report, May 30, 2018, https://money.usnews.com/money/retirement/articles/2018-05-30/what-happens-if-we-all-run-out-of-money-for-retirement.
- Alana Semuels, “This Is What Life Without Retirement Savings Looks Like,” The Atlantic, February 22, 2018, www.theatlantic.com/business/archive/2018/02/pensions-safety-net-california/553970/.
- “Unstable or Low-Wage Jobs Make Up More than ½ Older Workers’ Job Growth,” The New School: Schwartz Center for Economic Policy Analysis, May 4, 2018, www.economicpolicyresearch.org/jobs-report/april-2018-unemployment-report-for-workers-over-55.
- Amanda Dixon, “The Average Retirement Age in Every State in 2016,” SmartAsset, March 29, 2017, https://smartasset.com/retirement/average-retirement-age-in-every-state-2016.
- “Population Ages 65 and Above (% of Total),” The World Bank, 2017 revision, https://data.worldbank.org/indicator/SP.POP.65UP.TO.ZS?end=2016&locations=US-JP-IT-DE-PT-FI-BG-GR-SE-LV&start=1960&view=chart&year_high_desc=true.
- Patrick W. Watson, “Boomers Are Not Saving Enough for Retirement, Neither Is the Government,” Forbes, October 12, 2017, www.forbes.com/sites/patrickwwatson/2017/10/12/boomers-are-not-saving-enough-for-retirement-neither-is-the-government.
- “40% of Older Americans Will Experience Downward Mobility,” The New School: Schwartz Center for Economic Policy Analysis, February 14, 2018, www.economicpolicyresearch.org/insights-blog/40-of-older-americans-will-experience-downward-mobility-in-retirement.