There have been some extraordinary sunsets where I live. One day as I ran through the orange groves, I turned a corner and was stopped in my tracks—not by a snake, as has occasionally happened, but by the beauty of an amazing cloudscape. The sky was painted all sorts of colours looking as if a painter had crafted it with a magic brush. What struck me most was the intensity of the sunbeams slashing through the clouds and across the sky.
My first thought: I must paint this.
My second thought: I must find a way to put this on a map.
So what to map? I have several in-the-works ideas about incorporating clouds in projects because, to be honest, if I get to add a cloud to something, it makes me happy. However, I specifically wanted to incorporate those sunbeams. Finally, the idea came to me. I could map the sunniest cities in America and use those beams thematically to showcase those cities.
I enjoyed the idea so much that I decided to make two maps! The first was more of a drawing, and the second was a 3D example.
I ran over to the National Oceanic and Atmospheric Administration (NOAA) to find out what the sunniest cities in America are.
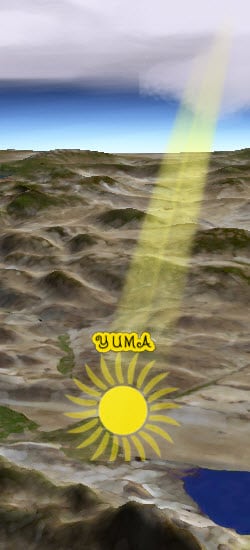
1. Yuma, Arizona
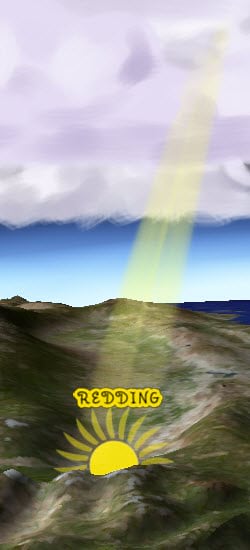
2. Redding, California
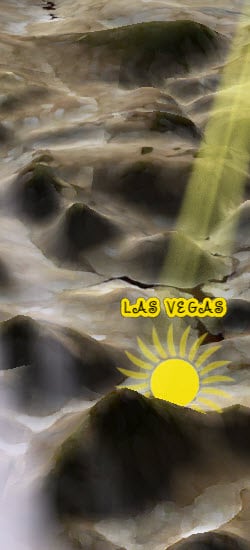
3. Las Vegas, Nevada
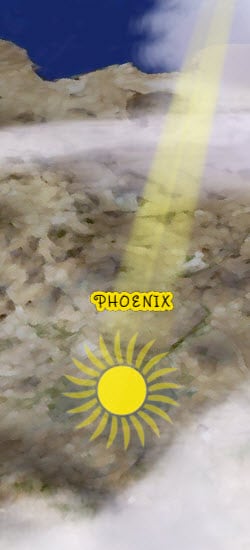
4. Phoenix, Arizona
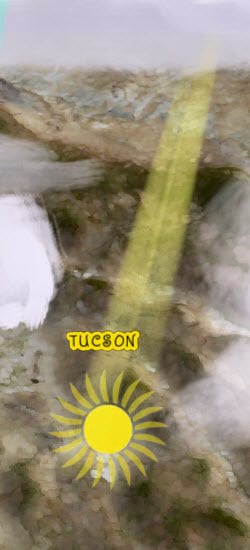
5. Tucson, Arizona
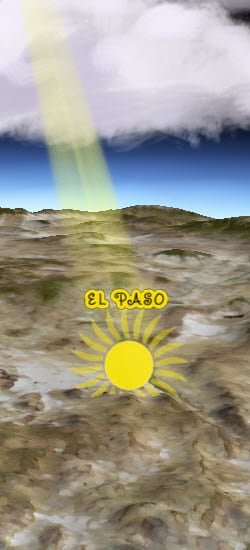
6. El Paso, Texas
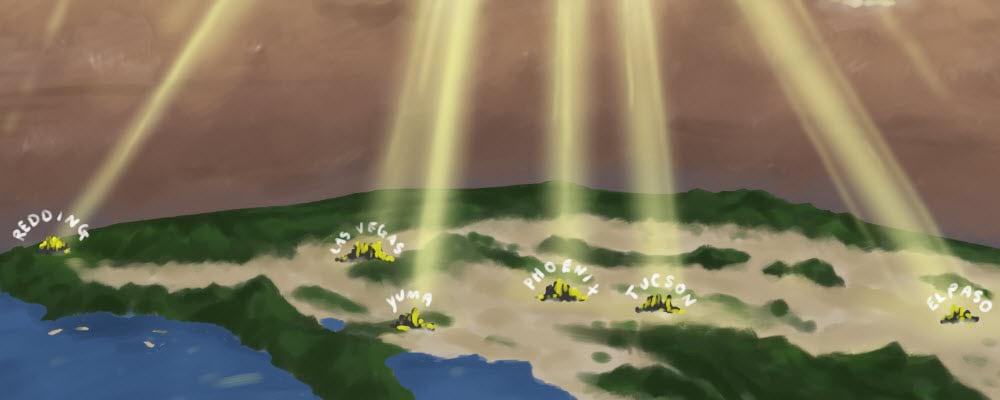
Map One
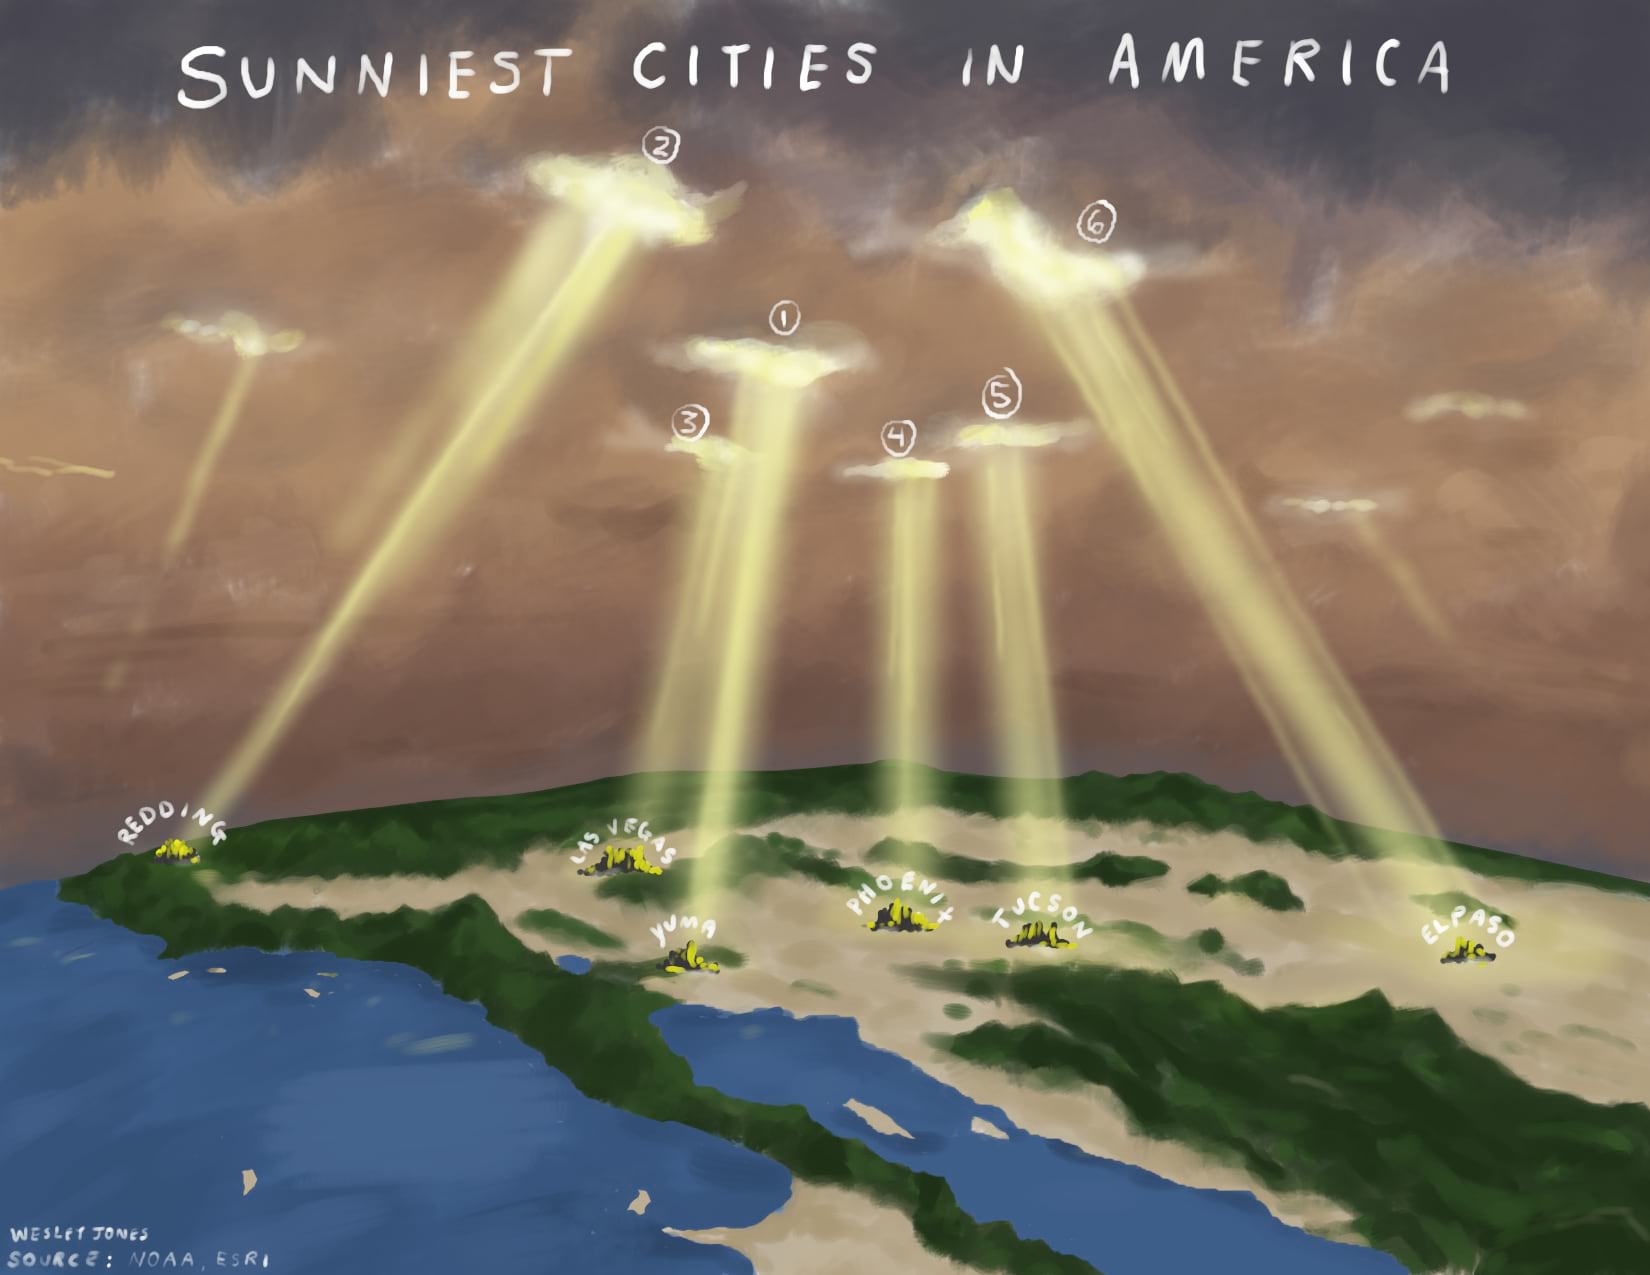
As this map was more painterly, I did most of the work in my favourite drawing package, but ArcGIS Pro was extremely useful in getting this right.
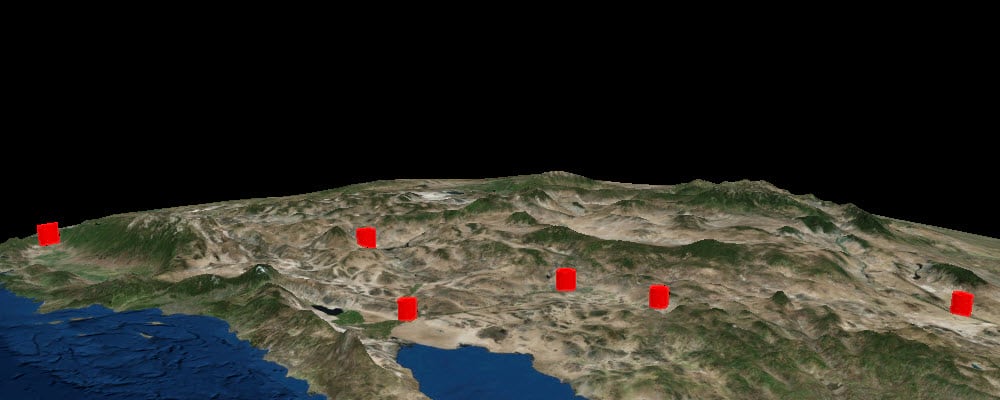
1. In ArcGIS Pro, I found the perfect angle.
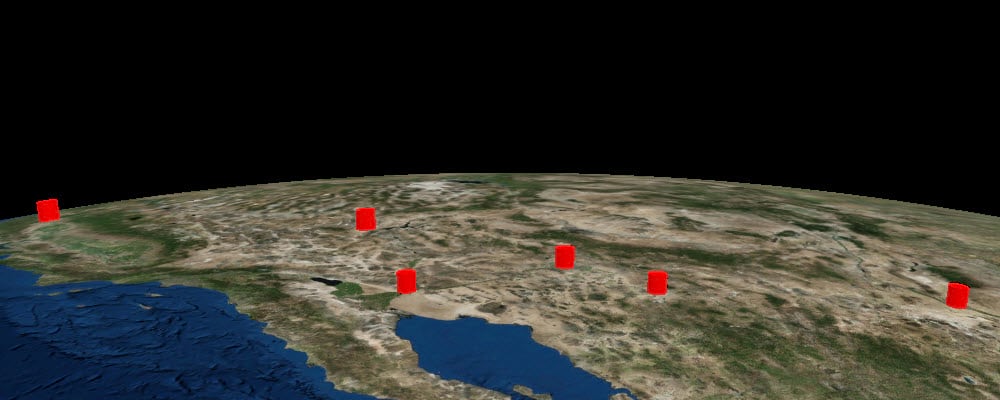
2. But it is amazing how flat the earth actually is, so I bumped up the vertical exaggeration 25 times.
3. Then I painted it.
Map Two
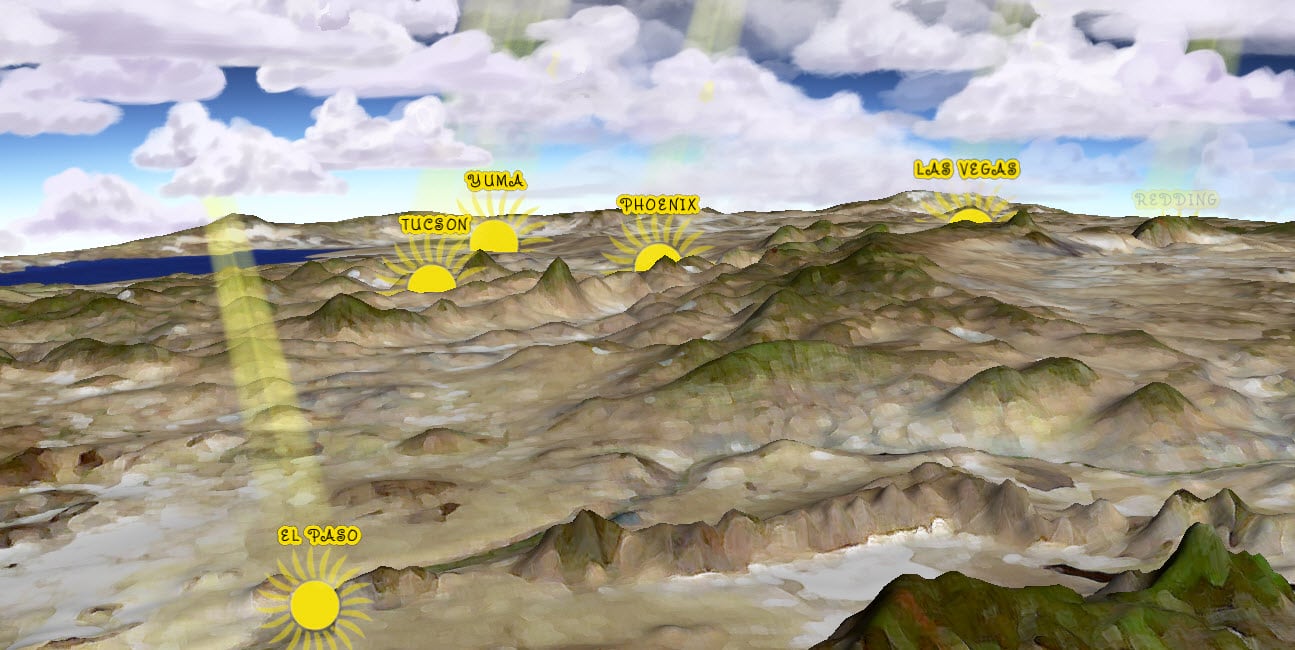
In case you are like me and appreciate the potential of 3D and enjoy working in it, here are the steps I took to make the map above:
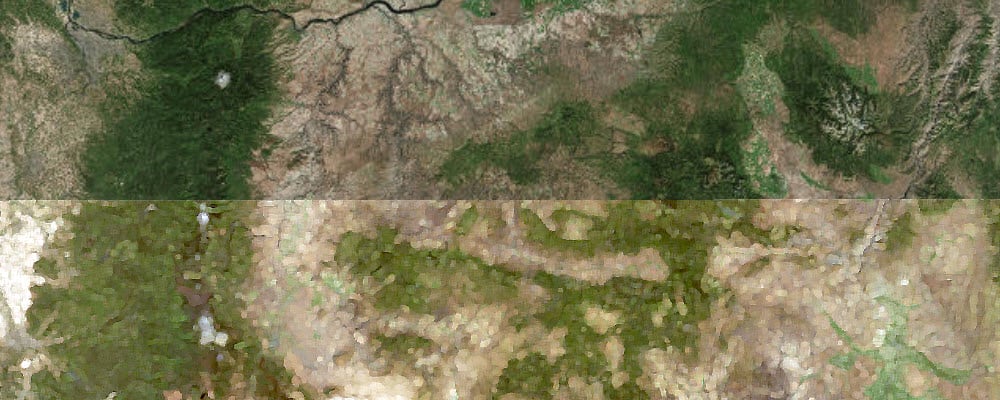
1. I wanted to maintain that painterly look, so I exported the imagery, applied some effects in a graphics package, and georeferenced that image back into place.
2. I then drew some suns.

3. Next, I included some clouds (my favourite part).
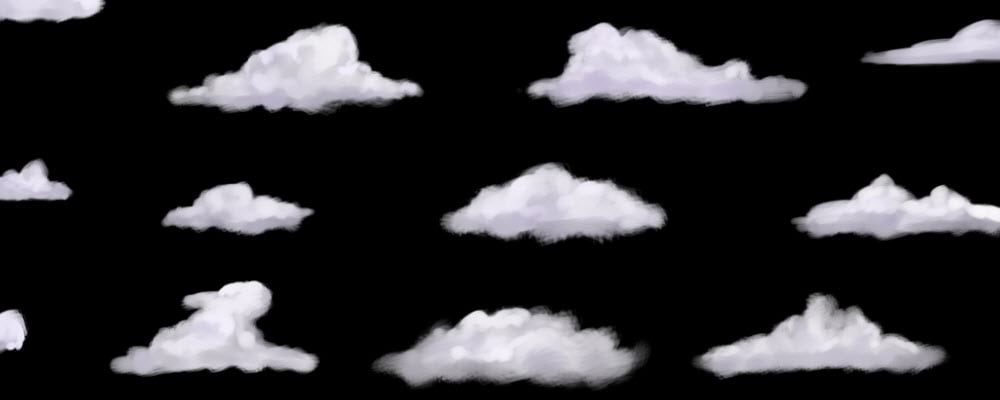
4. And I added some sunbeams.
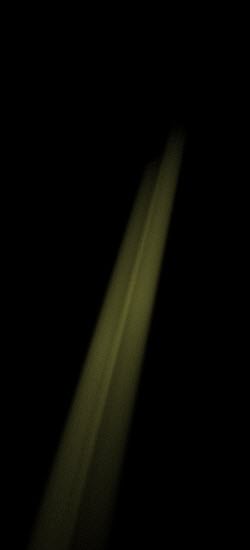
5. I placed the sun, sunbeam, and cloud icons into the scene. You can totally have these assets too. I went on to place
• The sun at each city’s centre.
• The sunbeams at the city centre as well.
• The clouds in aesthetically pleasing positions, adjusting their height with the handy placement tools.
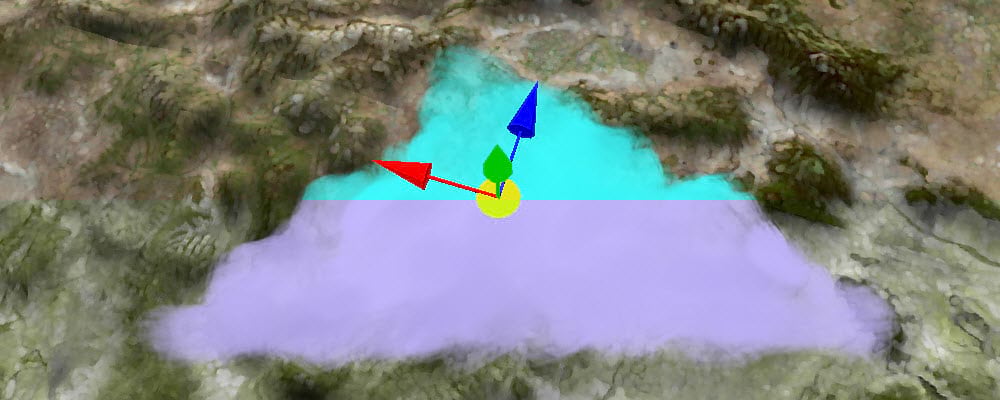
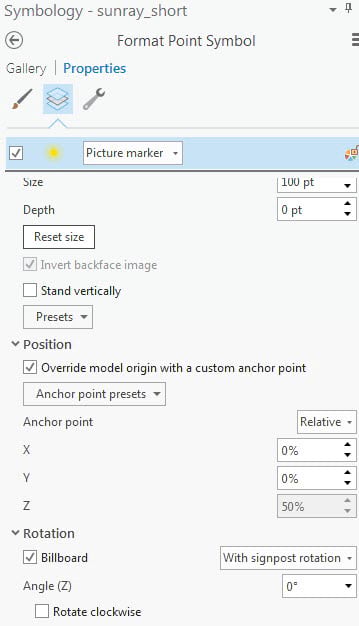
Also, I symbolized each feature with a picture marker and, importantly, I made sure the rotation was set to Billboard with signpost rotation. This ensures that the image is always facing the screen.
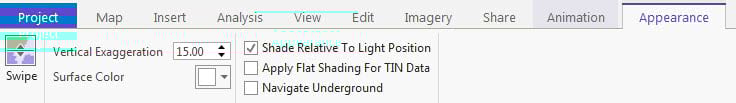
6. I changed the Atmospheric lighting and Illumination settings.

7. I changed the vertical exaggeration and shading.
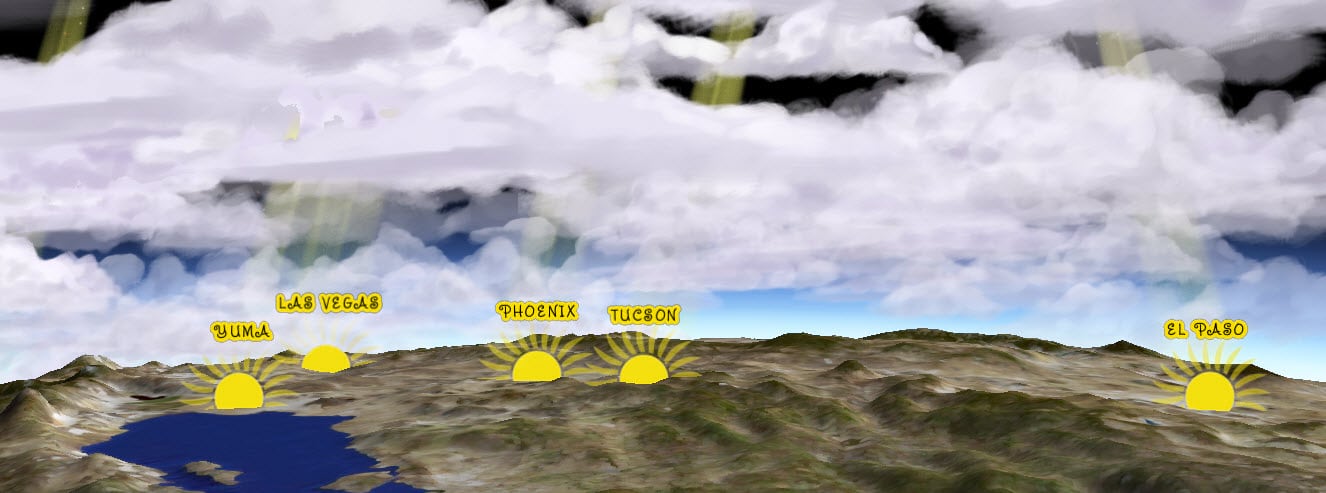
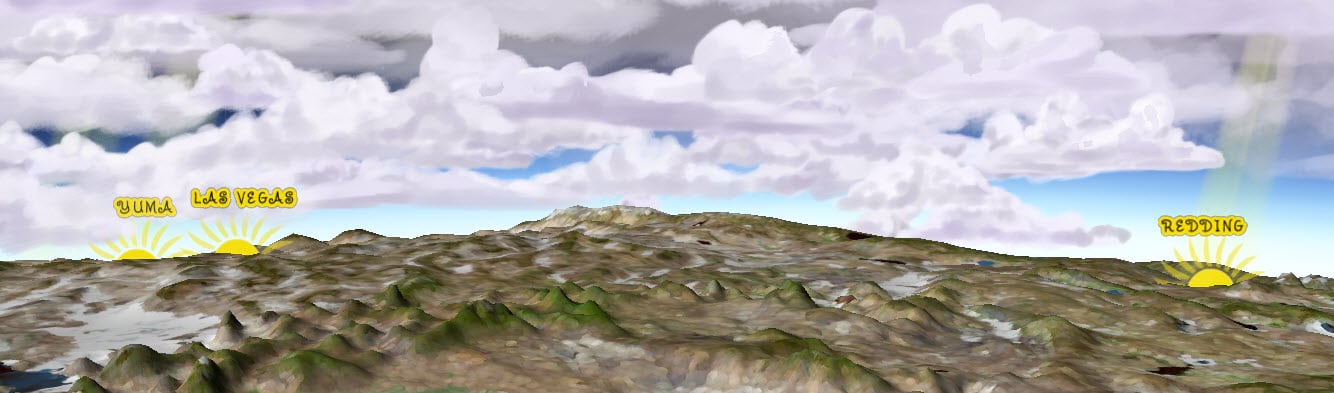
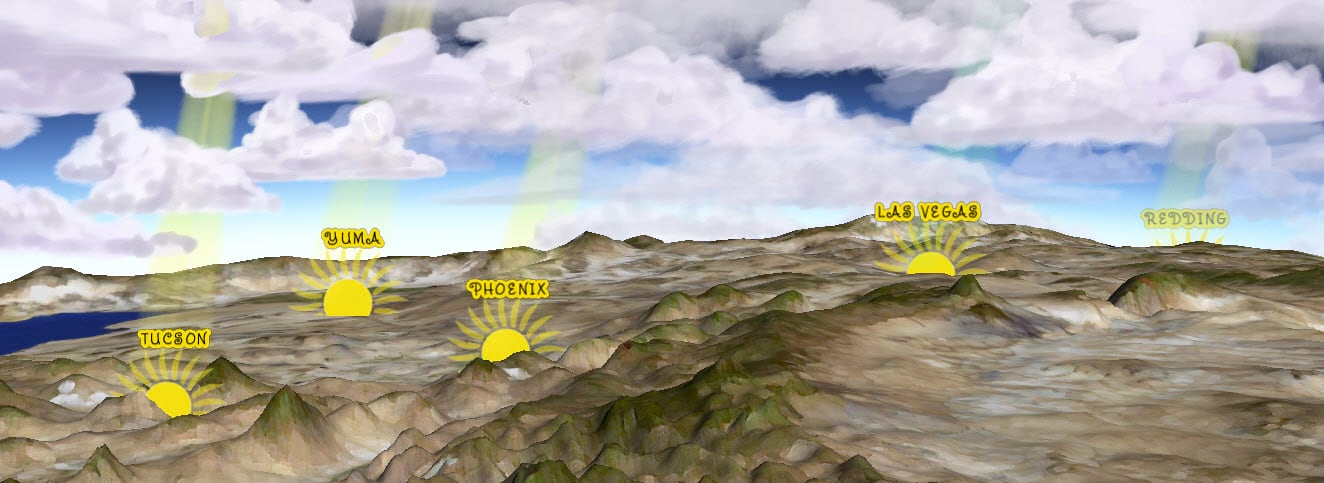
Here are a couple of stills from that scene.
Hopefully, this gives you some ideas for your projects. I had a blast making these maps.


Commenting is not enabled for this article.