
1.3956 and then 1.4004-11 are the next in line
The GBPUSD is on a runaway mission to the upside and begs the question "What are the next targets?"

Looking at the daily chart, the 50% of the move down from the June 2015 high is approaching at 1.39563. Above that are swing lows from April 2016 in June 2016 at 1.4004 and 1.4011 respectively.
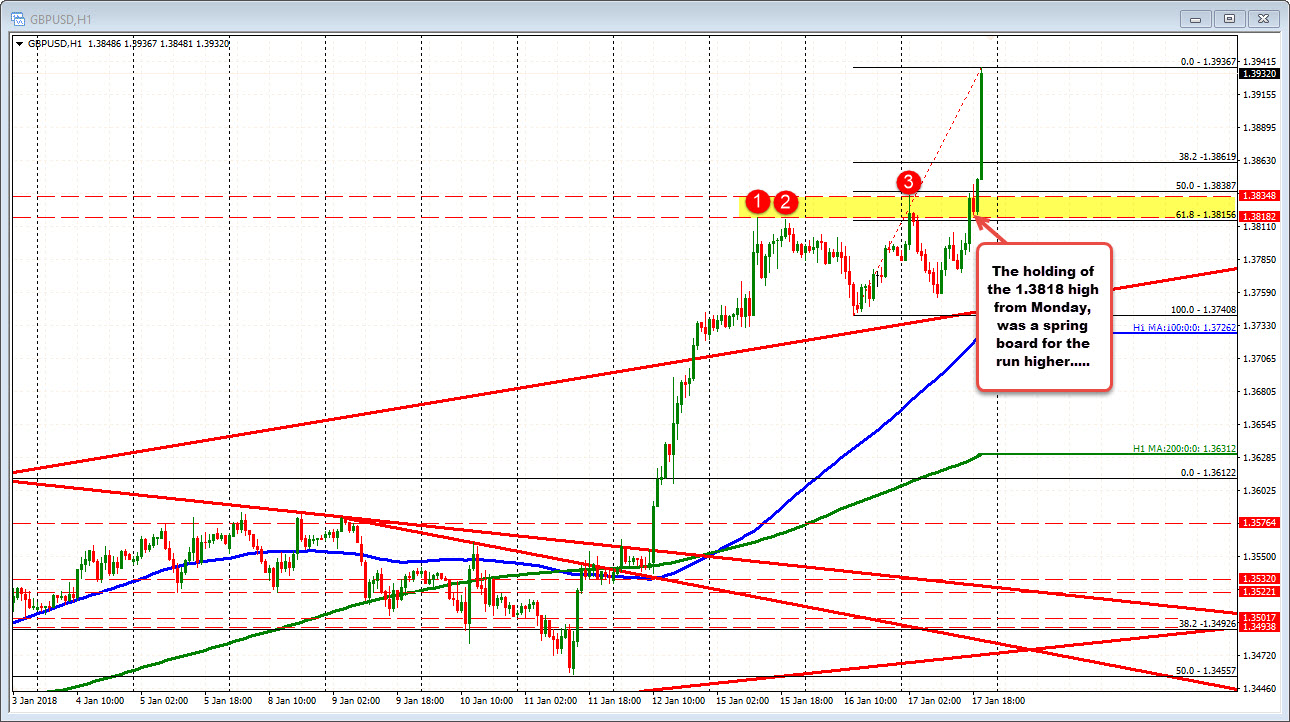
Drilling down to the hourly chart, the price of the GBPUSD waffled above and below the 1.38348 level earlier. That level was the swing low from February 2016. However, the low during that "waffling" stayed above the high from Monday at 1.3818. That - and the rebreaking of the 1.38348 level - led to the shorts giving up and the buyers racing this pair higher.
It is hard to get in the way of a runaway market, so be careful. This baby could have more to go.
PS be aware that on my retracements I am not using the October 2017 low. The reason is there was a flash crash on that day that had a slew of lows - dependent on your market maker. Those lows were varied. The price rebounded in seconds. As a result, I prefer to use the Jan low. It is not perfect but think is a truer measure in a messy chart.

