Extracting value from your logs with Stackdriver logs-based metrics
Mary Koes
Product Manager, Google Cloud
Most developers know that logs are important for debugging purposes but struggle in extracting value from the massive volume of logs generated across their system. This is where the right tools to extract insights from logs can really make a difference. Stackdriver Logging’s improved analytics tools became available in beta earlier this year and are now generally available, and being used by our customers.
Logs-based metrics are the cornerstone of Stackdriver Logging’s analytics platform and allow you to identify trends and extract numeric values out of the logs. Here are a few examples of how we’ve seen customers use logs-based metrics.
Filter on labels
As a simple example, we have a sample App Engine restaurant application that includes a parameter that includes food ordered in the URL. We want to be able to count the number of each menu item ordered. Logs-based metric labels allow you to use a regular expression to extract the desired field.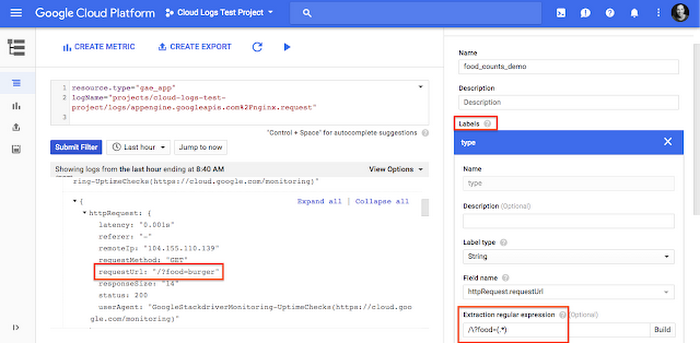
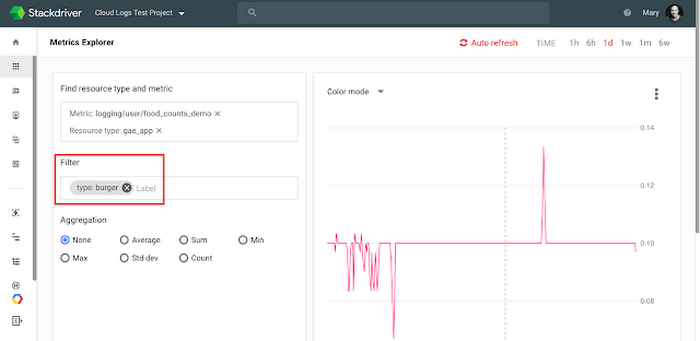
You can then view the logs-based metric, filter on the labels or create alerts in Stackdriver Monitoring. In the example below, we use Metric Explorer to filter down to just “burgers” and can see the rate of orders placed over the last day.
Google Cloud Apigee needed to take their terabytes of rich log data and understand errors and latency for each service they run across each region. They used logs based metric labels to extract the service and region directly from the log entry. As Madhurranjan Mohaan, software engineer at Apigee explains, “Parameterizing log searches based on labels have really helped us visualize errors and latency across multiple charts. It’s great because it’s parameterized across all regions.”
Extract values from log entries with distribution metrics
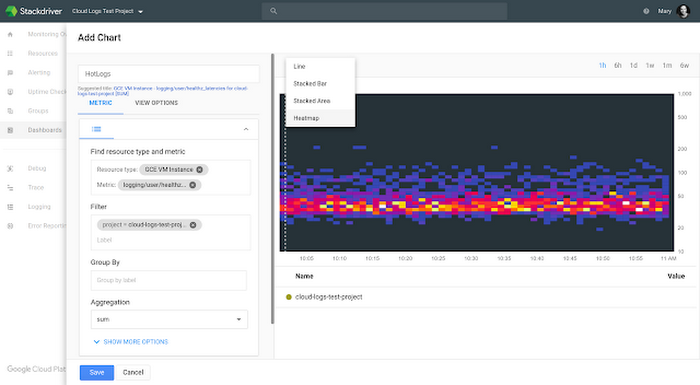
Waze uses distribution metrics to extract fields such as latency from their log entries. They can then view the distributions coming from logs as a heat map in Stackdriver Monitoring.As a simple example, we have an application running on Compute Engine VMs, emitting logs with a latency value in the payload. We first filter down to the relevant log entries that include the “healthz” text in the payload and then use a regular expression to extract the value for the distribution logs-based metric.
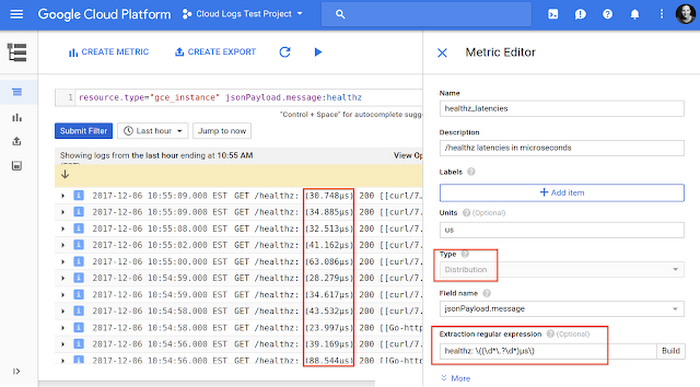
In Stackdriver Monitoring, we can visualize the data. In the example below, we add the chart as a heatmap to a custom dashboard. We could also instead choose to visualize it as a line chart of the 99th percentile, for example, by changing the aggregation and visualization.
Alert on matching log entries
Another common use case is to get notified whenever a matching log entry occurs. For example, to get an email whenever a new VM is created in your system, you can create a logs-based metric on log entries for new VMs and then create a metric threshold based alerting policy. To see how to do this, watch this short video.
You can also use logs-based metrics to gain insight into the performance of Google Cloud Platform (GCP) services. For example, recently, our BigQuery team did an analysis of easily fixed errors that BigQuery users commonly encounter. We discovered that many users received rateLimitExceeded and quotaExceeded. We found that using logs-based metrics can improve the user experience by adding visibility to BigQuery administrators. You can read more about this analysis here.
We hope these examples help you to leverage the power of Stackdriver Logging analytics. If you have questions, feedback or want to share how you’ve made logs based metrics work for you, we’d love to hear from you.