Talking Points:
- Gold prices shrug off upbeat US PMI data as FOMC meeting outcome nears
- Crude oil prices bounce as Saudi Arabia pledges exports cut, API data on tap
- Are commodities matching DailyFX analysts’ bets? Read the forecasts to see
Gold prices stalled, shrugging off an encouraging set of July US PMI figures that showed nonfarm activity growth grew at the fastest pace in six months. The outcomes were apparently insufficient to inspire a rethink of the recent dovish turn in Fed rate hike expectations ahead of the FOMC policy announcement due later in the week. Consumer confidence data is on tap ahead but may produce similarly lackluster results.
Crude oil prices turned higher after Saudi Arabia stressed its commitment to chipping away at the global supply glut with a promise of deep export cuts next month. Meanwhile, industry heavy-weight Haliburton Co. said US output might slow as prices’ struggle to maintain upward momentum discourages drillers. The spotlight now turns to API inventory flow data.
Have a question about trading crude oil and gold? Join a Q&A webinar and ask it live!
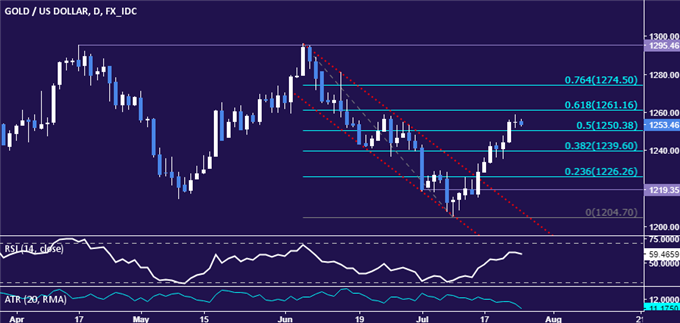
GOLD TECHNICAL ANALYSIS – Gold prices paused to digest gains after touching the highest level in a month. From here, a daily close above the 61.8%Fibonacci retracementat 1261.16 targets the 76.4% level at 1274.50. Alternatively, a turn back below the 50% Fibat 1250.38 opens the door for a retest of the 38.2% retracement at 1239.60.

Chart created using TradingView
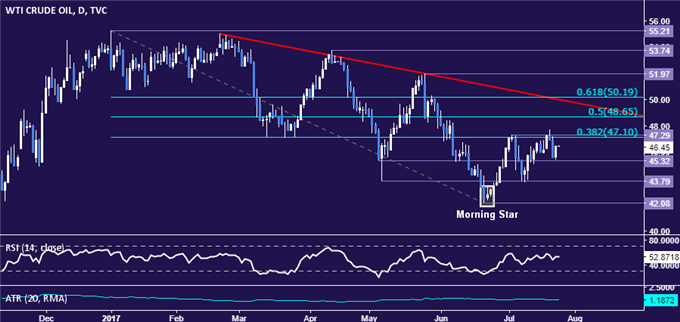
CRUDE OIL TECHNICAL ANALYSIS – Crude oil prices continue to consolidate below resistance in the 47.10-29 area (38.2% Fibonacci retracement, July 4 high). A daily close above that exposes the 50% Fib at 48.65. Alternatively, a reversal below support at 45.32 targets the May 5 low at 43.79 anew.

Chart created using TradingView
--- Written by Ilya Spivak, Currency Strategist for DailyFX.com
To receive Ilya's analysis directly via email, please SIGN UP HERE
Contact and follow Ilya on Twitter: @IlyaSpivak


