“Every morning in Africa, a gazelle wakes up. It knows it must run faster than the fastest lion, or it will be killed. Every morning a lion wakes up. It knows it must outrun the slowest gazelle, or it will starve to death. It doesn't matter whether you are a lion or a gazelle. When the sun comes up, you better start running.”
-- Thomas L. Friedman, The World Is Flat: A Brief History of the Twenty-first Century
Why a flat world? Because in every industry at every level, the middle man is being cut out and consumers are going directly to the source. The formal term for it is disintermediation – and we’re seeing it everywhere: Twitter and Facebook disintermediate the news industry; Uber and Airbnb the travel industry; Chinese e-commerce giant Alibaba the retail industry. Disintermediation is the the foundation of the sharing economy.
But how does this radical external transformation translate to internal transformation for your company? What does the ideal organization look like in a flat world?
The companies prospering in the future might be the ones that take advantage of decentralized, self-organized, globally distributed communities working together to produce value.
As the world flattens, we see organizations also flattening, challenging the intermediate levels. But they’re struggling to redefine the manager’s role. The org chart, while easy to understand, doesn’t represent how things get done or how innovation and value are created.
A better option is a network diagram. Managers can use network analytics to recognize, promote and efficiently distribute collaborative projects. Adjusting supply and demand at the level of their top collaborators will increase the success of the whole team.
Finding the top collaborators
Networks are a good representation of complex human systems; they capture the interplay between the structure and the behavior of their components (teams or individuals). Network visualization allows you to detect communities or clusters in partitioning the network so that links or exchanges within communities are denser than the links between communities.
Consider professional sport teams -- they don’t just measure goals, they also track assists. The sales person closing a strategic deal (scoring the goal) is only one part of the story. What were the assists (customer relationship management activities, for example) that helped make the sale? In order to analyze the assists to projects in your organization, and the value directly and indirectly tied to your employees, start by examining your network and asking two basic questions:
- What is the underlying structure linking the different projects and activities to cohesive groups, teams and employees?
- How are the groups linked to each other and who are the bridges between the communities?
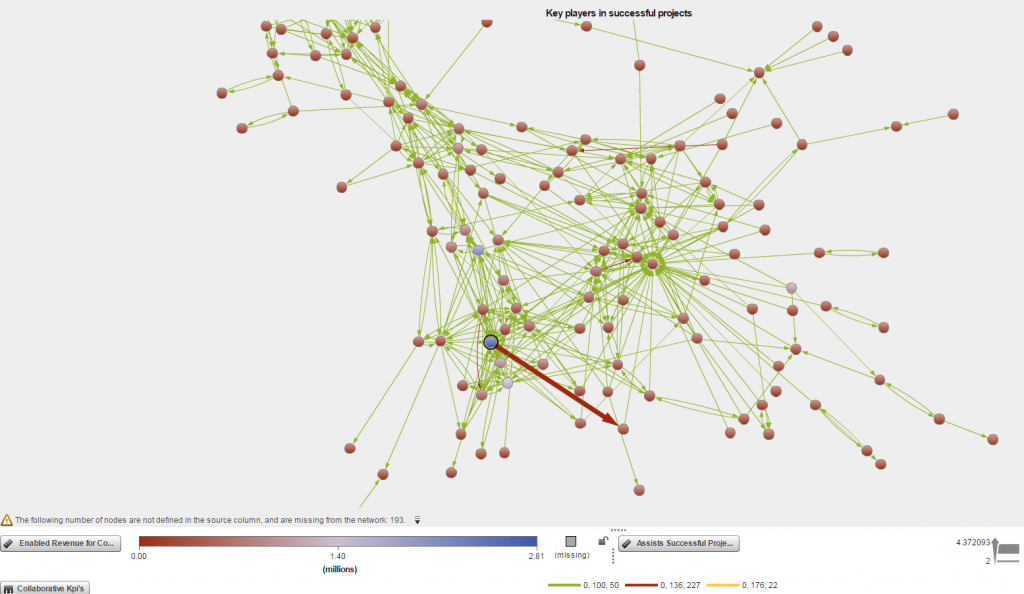
As we can see on the following network graph, cohesive groups or clusters exist within organizations and within those cohesive groups, individuals are able to quickly share resources, information and typically demonstrate higher levels of trust than in less cohesive groups.
The individuals who act as bridges from one cluster to another are crucial: They have wider access to diverse information, early access to new information and control over the distribution of information. They are, in fact, key to winning deals and successful projects.
In the following anonymized network extract of SAS employees, the employee at the center of the highlighted cluster is our Superman. He’s our hyper-collaborative bridge between different departments and virtual teams.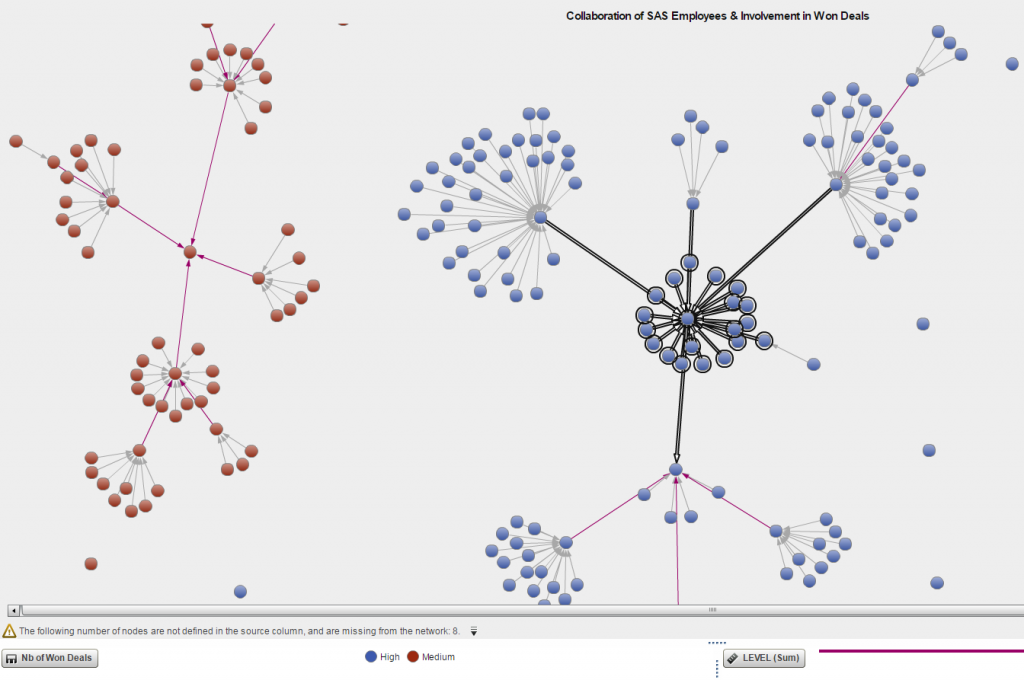
Network analytics can likewise identify critical nodes in projects within company networks by plotting different types of employee scores. The following Visual Analytics graph shows the collaborations between anonymized SAS employees in the context of successful projects (assists for a goal) for a specific period of time.
Two employees are connected if they’ve collaborated on a deal we won. The more times they’ve collaborated, the stronger the connection (grey arrows are for weak connections while pink arrows are for strong ones). Employees that collaborate often and participated in a lot of successful projects have more influence in the graph. This is indicated by the color of their nodes in the first graph (sum of the value of their assists in the context of won deals) and by the density of their directed connections.
Superpowers and kryptonite
Superman is special because he's from another planet and can do things nobody else can. In our network of employees, your Supermen (and superwomen) are the key actors in your network. And as they become known for being both capable and willing to help, they’re involved in projects of growing importance.
But we all know that even Superman is not completely unstoppable. There’s Kryptonite, the one thing that renders him helpless. The Kryptonite of your top collaborators is their limited time and resources. And even if intense collaboration starts as a virtuous circle, it can soon turn vicious. Without proper management, helpful employees might soon become institutional bottlenecks. Worse, they might become so overwhelmed by their network that they’re no longer effective.
Network analytics can help by highlighting the top collaborators that show up too often on the critical paths of too many projects.
Preventing burn-out
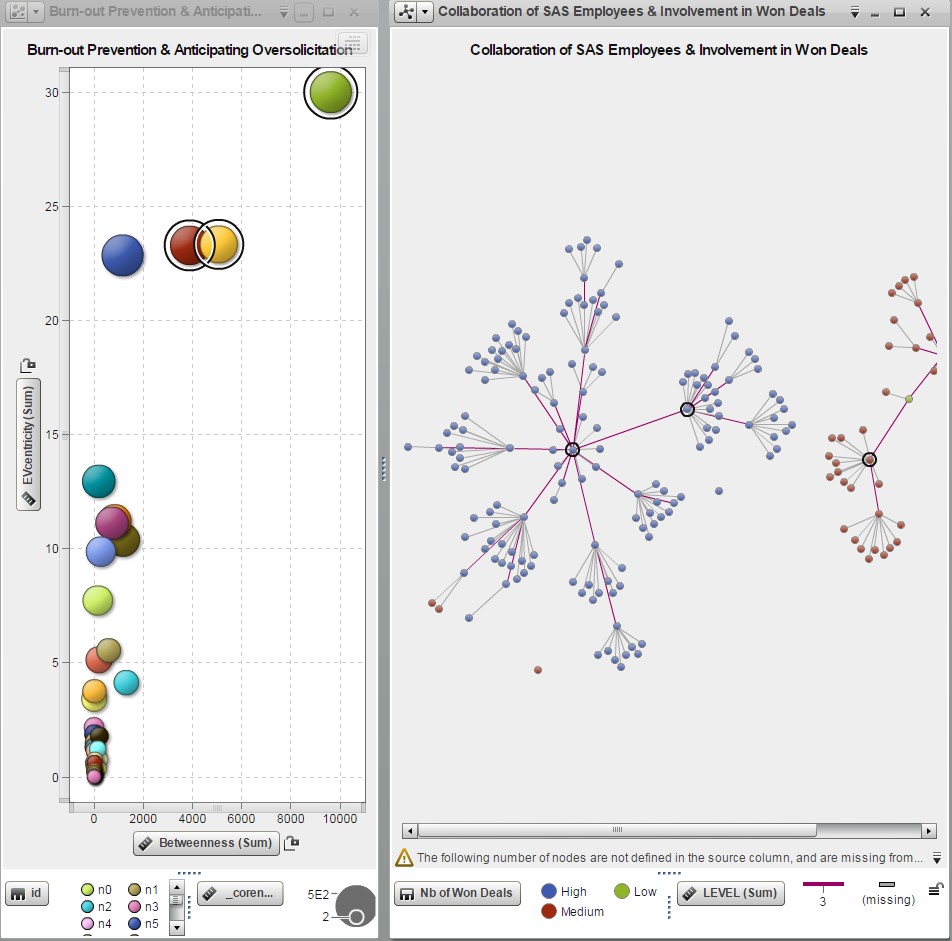
The best way to prevent burnout is to proactively redistribute workloads. You can identify critical employees in a company network by plotting employees’ scores for various measures typically used in graph and network theory, for example, Eigenvector centrality versus Betweenness:
- Betweenness measures the number of shortest paths an employee is on. A high score indicates it’s a likely path for information flows. In a directed network, top collaborators who are unreasonably solicited appear as typical bottleneck in the project flow.
- Eigenvector centrality is proportional to the centrality of an employee’s neighbors in the network. A high score indicates the employee is popular among popular employees, which might further fuel the waterfall effect of growing workload.
The following SAS Visual Analytics graphs highlights three employees with a high score on both measures. Their position in our network confirms that those employees might be at risk with the current distribution of the knowledge and of the project tasks.
Opportunities at the managing and hiring level
Everyone has an agenda -- you, me, and every potential candidate in the marketplace. Evolution made us goal-driven with a primary objective: Physical, and social survival. As far as our brain is concerned, without a goal everything is meaningless.
In our flat world, employee’s collaboration, learning and performance goals are most likely to accurately predict success. Analytics that combine demographic employee data, predictor variables (goals) and mediating variables (such as proactive behavior and emotional intelligence) will efficiently assess employees for future performance. Considering the amount of cross-functional interaction and emotional intelligence that’s required for managers in a collaborative ecosystem, this could prove an invaluable metric for hiring the managers you need. As Charles Darwin says: The grain in your balance.
“A grain in the balance will determine which individual shall live and which shall die - which variety or species shall increase in number, and which shall decrease, or finally become extinct.”
― Charles Darwin, The Origin of Species
To learn more about the power of visualizing your data, check out this Harvard Business Review white paper: Visualizing Data