
NIKKEI 225 Index Long-Term Technical Analysis: watch for key support to be broken for possible sell trade
2 December 2015, 06:11

0
692
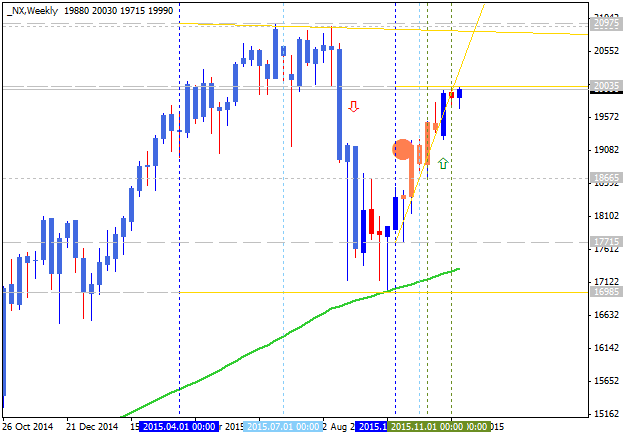
The price is located above 100 period SMA (100 SMA) and 200
period SMA (200 SMA) with the ranging within the following
support/resistance levels:
- 20975 resistance level located above 100 SMA and 200 SMA in the primary bullish area of the chart, and
- 16985 support level located within 100 SMA and 200 SMA on the border between the primary bearish and the primary bullish trend.
RSI indicator is estimating the bullish trend to be continuing.
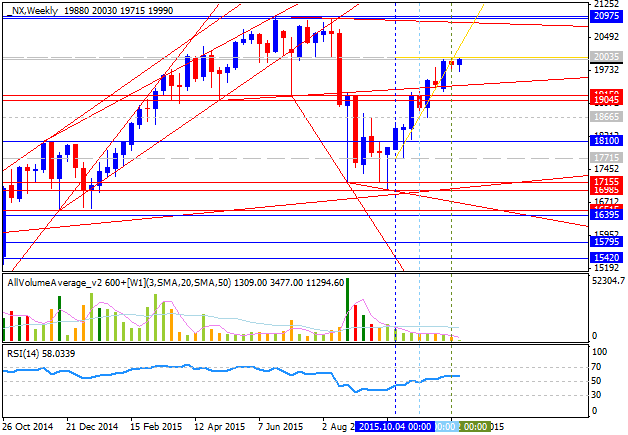
- If the price will break 20975
resistance level so the bullish trend will be continuing.
- If price will break 1863.1 support so the bearish reversal will be started with the secondary ranging.
- If not so the price will be ranging within the levels.
| Resistance | Support |
|---|---|
| 20975 | 18665 |
| N/A | 16985 |


