
USD/CAD: ranging bullish within symmetric triangle pattern

Skandinaviska Enskilda Banken (SEB) made a forecast for USD/CAD with the following advice: if the price breaks 1.3247 so we may see the local downtrend as the secondary correction with the next target to be below 1.32 for example. Let's evaluate this forecast with the technical point of view.
USD/CAD: ranging bullish within symmetric triangle pattern. The pair is located to be above 100 period SMA (100 SMA) and 200 period SMA (200 SMA) for the primary bullish market condition with the secondary ranging within the following key support/resistance levels:
- Fibo resistance level at 1.3456, and
- Fibo support level at 1.2831.
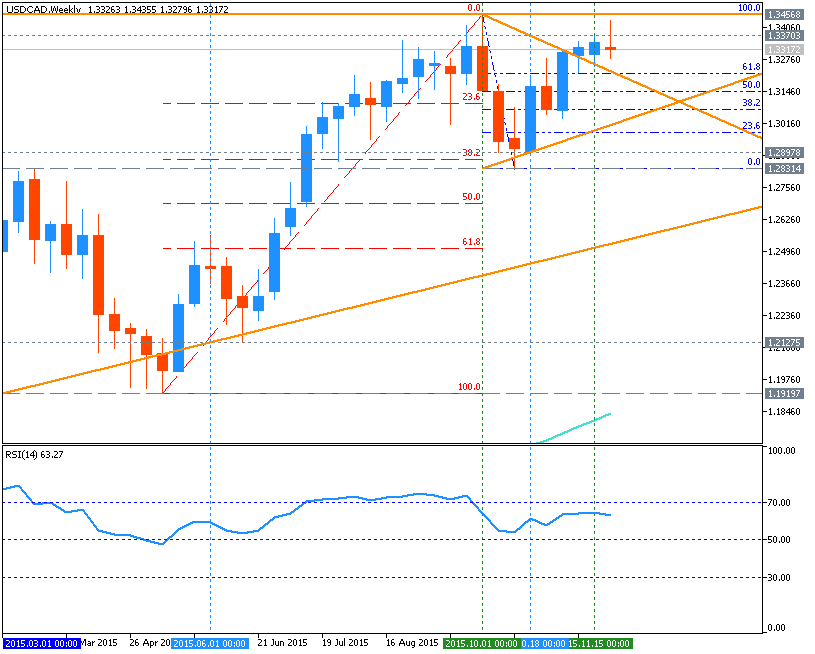
The price is inside symmetric triangle pattern to be broken for the direction. Bearish key reversal level is 1.1919, and if the price breaks this level to below so the bearish reversal will be started. And RSI indicator is estimating the ranging bullish market condition by direction.
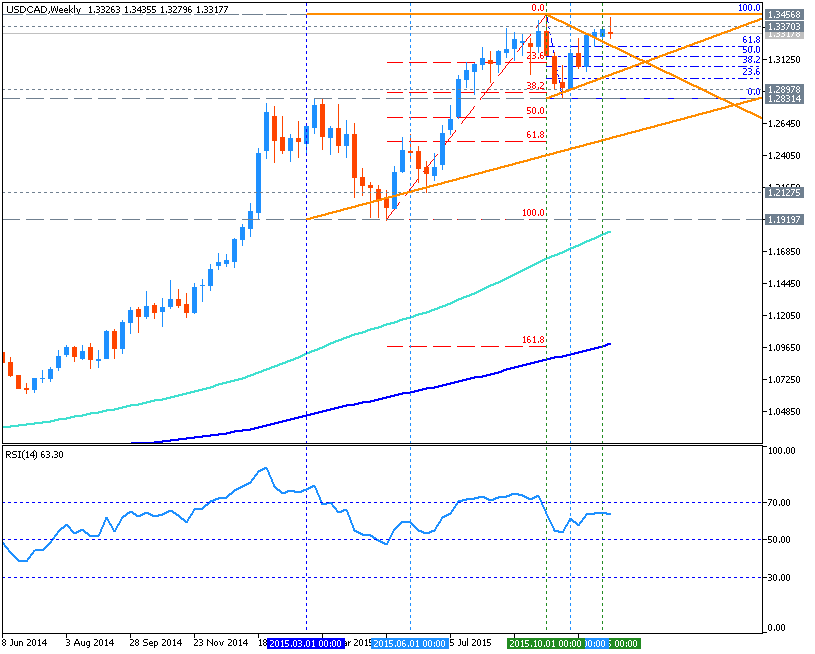
- if the price breaks Fibo resistance level at 1.3456 so the bullish trend will be continuing;
- if the price breaks Fibo support level at 1.2831 so the local downtrend as the secondary correction within the primary bullish market condition will be started;
- if not so the price will be moved within the channel.
| Resistance | Support |
|---|---|
| 1.3456 | 1.2831 |
| N/A | 1.1919 |
- Recommendation for long: watch close the price to break 1.3456 for possible buy trade
- Recommendation
to go short: watch the price to break 1.2831 support level for possible sell trade
- Trading Summary: bullish


