5 Must-Use Google Analytics Strategies to Measure SEO Success Going beyond just measuring keyword rankings allows marketing teams to showcase what really matters: how organic search brings revenue and profit to the business.
By Dallas McLaughlin •
This story originally appeared on KISSmetrics

You know what they say, "If you can't measure it, you can't improve it." In Search Engine Optimization measurement is critical to success. Sure, keyword rankings are a great measure of SEO. More keywords ranking higher means more traffic, right? But, reporting solely on keywords devalues the marketer's role and doesn't paint the full picture of why SEO is important to the organization. Going beyond keyword rankings allows marketing teams to showcase what really matters: how organic search brings revenue and profit to the business. Thankfully, one of the best tools for measuring SEO is freely available, and probably already installed on your website – Google Analytics!
Although every business is unique and every website has different metrics that matter, this post is a universal list of 5 ways to use Google Analytics to report the success of your businesses SEO efforts.
1. How to View Only Organic Search Traffic
This one might seem obvious. I'm always surprised at how many companies see a decline in overall website traffic and immediately jump to the conclusion that the traffic loss is due to a decline in organic search traffic. Many times digging a little deeper can actually reveal that organic traffic is up while other traffic sources are down which is resulting in the overall traffic decline.
The first step in looking at Organic Search traffic over time is to open yourChannel Grouping report which can be found by clicking Acquisition > All Traffic > Channels. There you will see traffic sources segmented by channel.
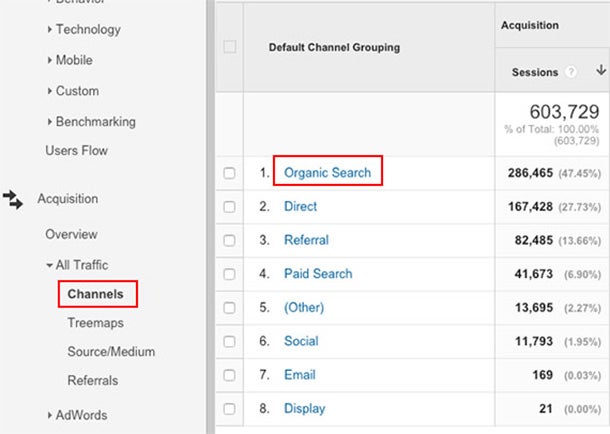
Clicking on the "Organic Search" channel will give you a more detailed report which includes only organic search traffic metrics.
Click to Enlarge+
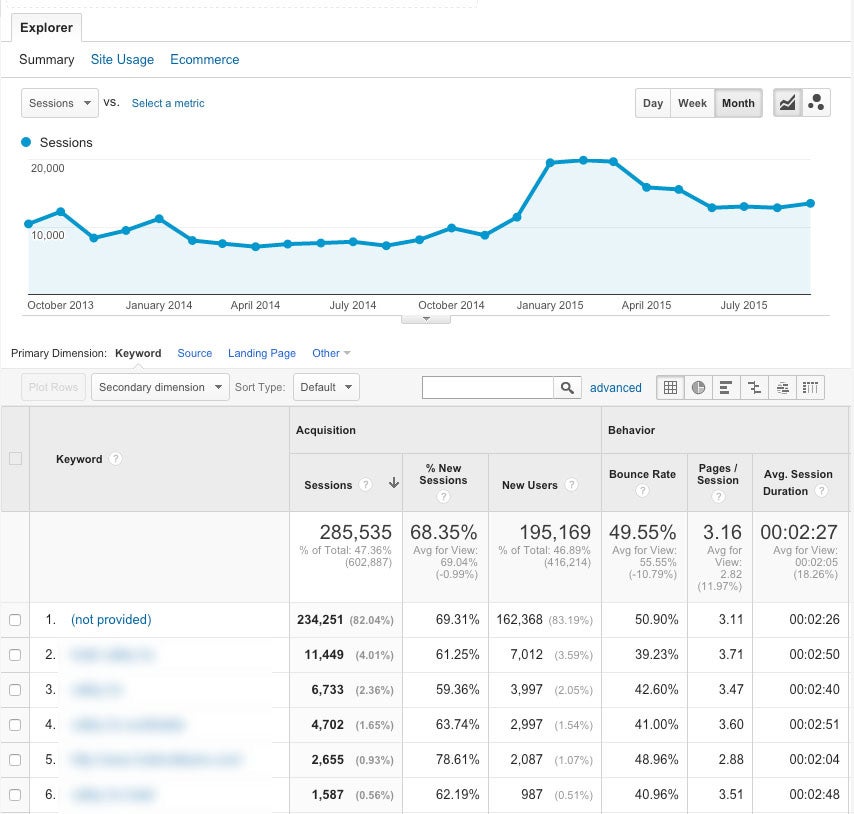
This report will be the Swiss Army Knife to your SEO reporting. From this report you can determine things such as the top landing pages for search traffic, keywords driving the most traffic, which search engines are sending the most traffic, top exit pages and much, much more.
2. How to Measure The Quality of SEO Traffic
A lot of times I hear that "quality" is subjective, so you can't really measure it. I don't believe this to be true and in fact, I'd say there are a lot of ways to measure the quality of any traffic source, not just search.
The most common report I use to measure an improvement or decline in the quality of search traffic is the Assisted Conversions report (Conversions > Multi-Channel Funnels > Assisted Conversions). With this report active I like to start by setting the date range to "Last month' and comparing it to "Previous period'. What you're left with is a month-to-month comparison of conversions directly from search, or in the event of multiple visits to the site, conversions where search played a role but is not directly attributed with the conversion (ie: the visitor found the company through search, but returned directly and converted).
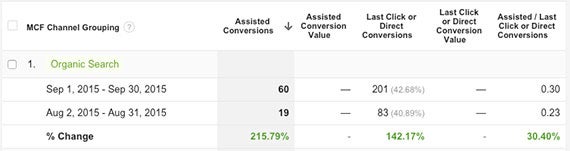
Use this report to look for a decline or improvement in conversions from search traffic. If businesses notice a decline in conversions from search, yet overall search traffic is steady, it's easy to determine that the traffic coming from search is not qualified or of a very high quality.
Likewise, if you begin focusing on a more refined set of keywords and see an improvement in conversions from search traffic, you can say your SEO traffic quality is improving.
3. Assigning Dollar Values to Organic Traffic
This is a strategy I use for businesses who are looking for a more traditional way to understand the value SEO is bringing to their business beyond improvements in traffic, visibility and conversions by assigning a dollar value to their organic traffic results. To assign a total dollar value to a sites organic traffic, I compare how much the keywords would cost if purchased in a Google AdWords campaign.
Note: For this strategy to work you will need access to a Google AdWords account, and your Analytics will need to be synced with your Search Console account.
To find a sites keyword search phrases and queries, navigate to Acquisition > Search Engine Optimization > Queries.
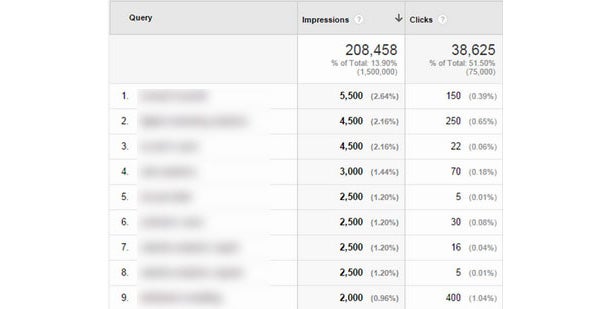
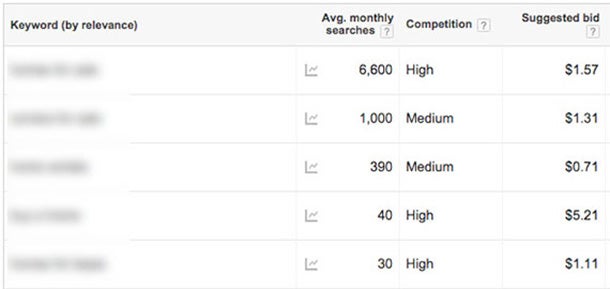
With this report pulled up, open your AdWords account in a new tab and clickTools > Keyword Planner. For this strategy we want to choose "Get search volume data and trends", enter the top keywords from your Google Analytics Queries report, and click "Get search volume." On the next screen click "Keyword Ideas." Each keyword you've entered will have a Suggested Bid amount which is an estimate of what advertisers are currently paying per click for each keyword listed.
In a spreadsheet I will list all known keywords driving traffic to the website, the amount of click-throughs from each keyword, and the estimated cost-per-click. The final column in the spreadsheet is the sum of the estimated cost per click multiplied by the amount of clicks, resulting in the total organic traffic value per keyword.
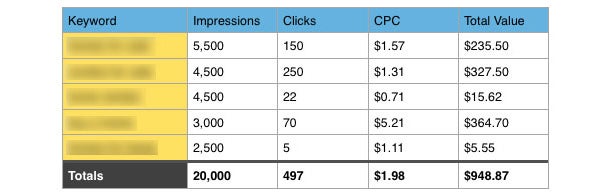
This is a great strategy to visualize what kind of dollars and cents a businesses SEO strategy is saving them on traffic they would otherwise have to pay for.
4. Identifying Slow Loading Page Times
The need to optimize page load times is one item that is majorly overlooked by many SEO's. In addition to how slow loading pages affect the user experience, page speed has become a major factor in search rankings. That's why I always suggest that if a business is investing time and money in SEO and keyword rankings, don't blow it by overlooking a slow loading website.
While we aren't going to talk about how to make a website load faster, I want to look at how to identify slow loading pages and measure their impact on conversion rates.
To measure page load times on a page-by-page basis navigate to Behavior > Site Speed > Page Timings. I like to set the middle column to "Avg. Page Load Time' and the right column to "% Exit'. I also will typically add a "Secondary Dimension' of Medium, and filter down to show only organic traffic.
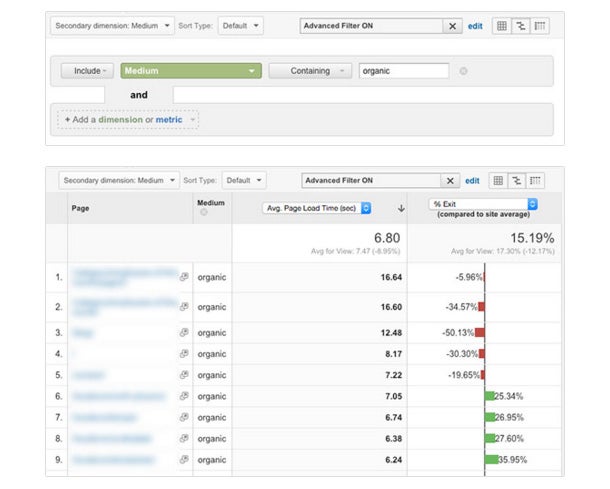
What this report shows us in the top most row is the average page load time site wide, and the average exit percentage (where a visitor decides to leave the site) on a page-by-page basis. It's also fairly easy to see in this report that as our page load time surpasses our site wide average, our exit percentages begin to skyrocket.
As an SEO, what I will do is bring this report to the site developers and ask them to do everything they can to optimize page load times. Once page load times have been improved, I will run this same report and compare it to the old data to show how much additional search traffic we've retained, and most likely converted due to the improvement in page load times.
5. Create Your Own SEO Dashboard
Sometimes all it takes to move a client or boss from a skeptic to a believer in your work is how the data is presented. It's easy as an internet marketer – or more specifically an SEO – to over explain ourselves, or lean on hard-to-grasp metrics. Sometimes all the client wants to see is bar graphs, pie charts and other less intimidating forms of measurement.
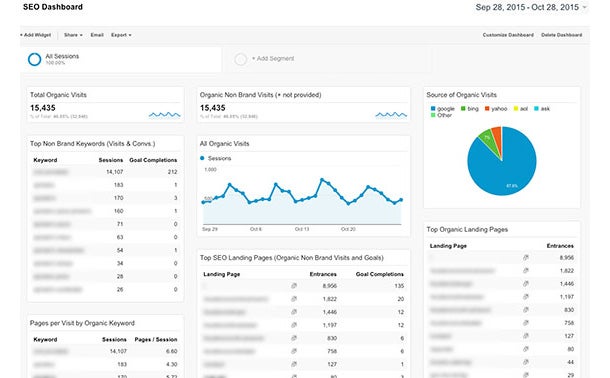
The best way I've found to present Google Analytics and SEO data is through the built in Dashboard interface. A Dashboard is essentially a series of Widgets which pull all of the individual reports into a single view which is easy to access, share, and print. The bonus to having an easily presentable PDF of SEO metrics is the fact that having this dashboard will also cut down on your time spent reviewing Analytics letting you focus on actually doing the SEO work.
If you want to skip the details and import my dashboard you can do that, otherwise click on Dashboards > + New Dashboard.
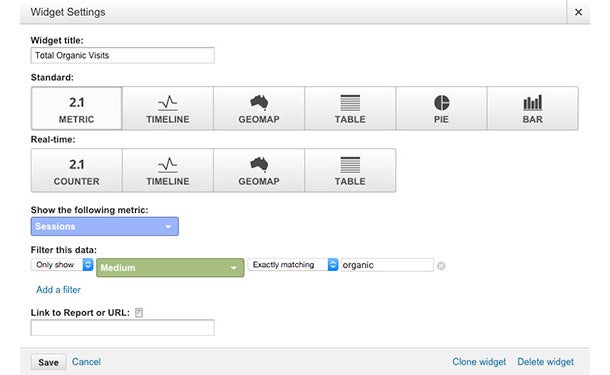
The first widget I always set up is a simple counter to measure total visits to the site from organic search. Click on "+ Add Widget", and title it "Total Organic Visits". For this widget I usually stick with the "Metric' display. Under "Show the following metric:" select "Sessions'. Since we only want to see traffic from organic search we need to create a filter. Under "Filter this data:" select Only show > Medium > Exactly matching > organic.
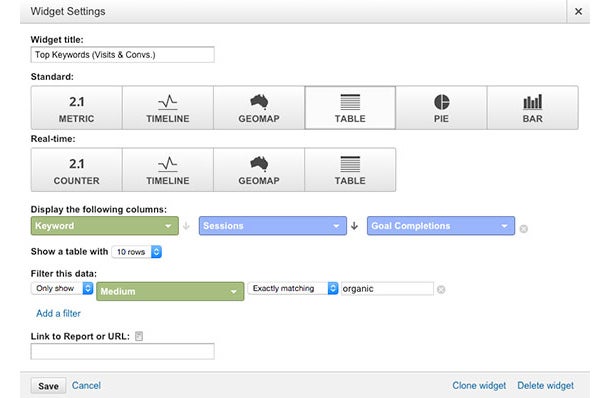
Let's set up one more widget. My second favorite widget measures keyword phrases sorted by the amount of sessions and goal completions resulting from the respective keyword. Let's add a new widget like before, but this time let's set our display as "Table". Under "Display the following columns:", choose Keyword > Sessions > Goal Completions. We also want to apply the same organic traffic filter as our first widget.
I like tailor these reports to the specific client, but other widgets I usually create include:
- All Organic Visits Over Time (Timeline)
- Top SEO Landing Pages
- Top Organic Keywords & % of New Visits
- Pages per Visit by Organic Keyword
- Most Successful Keywords by Goal Completions
Turning a Challenge Into a Strength
By far, the single most challenging aspect of being an SEO is being able to effectively articulate the value you are bringing to a business. It's easy for an SEO to show another SEO how his or her numbers are improving, but being able to quantify your work from a traffic and revenue stand point to a client or your boss is essential to earning and retaining business. If a client doesn't understand what that check they're writing is doing for their business, it won't be long before they stop writing that check.
Pay attention to what metrics resonate with your client or boss and find a creative way to represent this data in your monthly SEO reports. For extra brownie points, when clients or bosses have shared access to the Analytics I always make a point to walk them through the custom dashboards showing them exactly what each widget is tracking and why it's important to measure. Being able to educate your client on your process helps them appreciate the value you're bringing to their business and view you as an asset to their future traffic goals.


