Looking at the past can help you prepare for the future. So, here's what Black Friday e-commerce looked like last year.

This year won't likely be too much different, so plan accordingly.

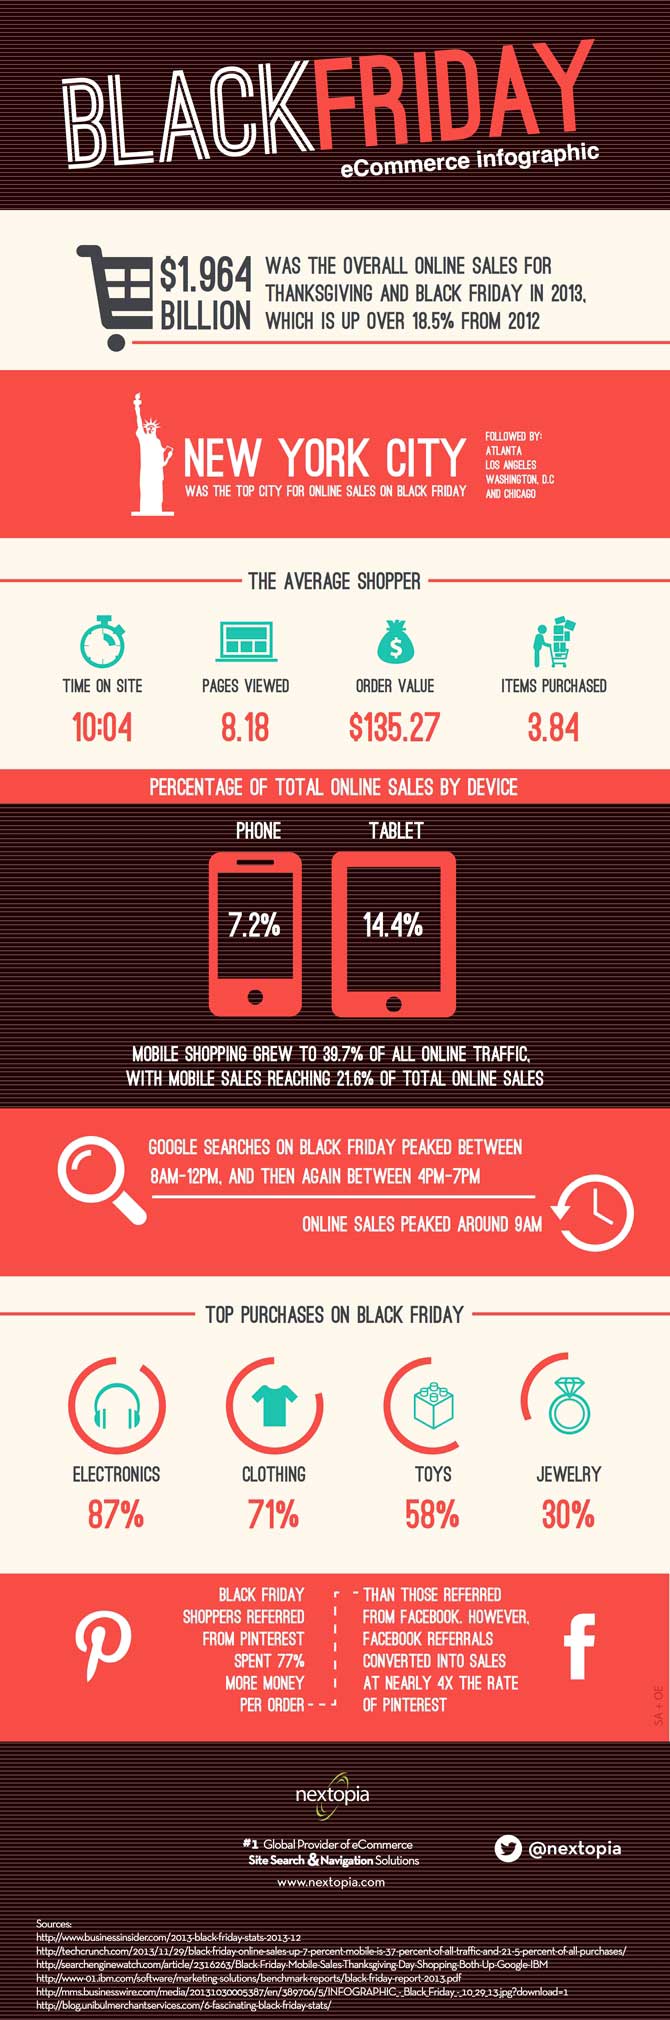
The overall online sales for Thanksgiving and Black Friday in 2013 was $1.964 billion, according to the infographic by Nextopia.

The top purchases were electronics (87% of shoppers), clothing (71%), toys (58%) and jewelry (30%).

Mobile shopping grew to 39.7% of all online traffic, with mobile sales reaching 21.6% of total online sales, Nextopia states.

To learn more about the previous Black Friday and plan for this one, check out the infographic:

Enter your email address to continue reading

What Might Black Friday E-Commerce Look Like This Year? [Infographic]

Don't worry...it's free!

Already a member? Sign in now.

Sign in with your preferred account, below.

Did you like this article?
Know someone who would enjoy it too? Share with your friends, free of charge, no sign up required! Simply share this link, and they will get instant access…
  • Copy Link

  • Email

  • Twitter

  • Facebook

  • Pinterest

  • Linkedin


ABOUT THE AUTHOR

image of Verónica Jarski

Veronica Jarski is managing editor at Agorapulse and a former editor and senior writer at MarketingProfs.

Twitter: @Veronica_Jarski

LinkedIn: Veronica Jarski