

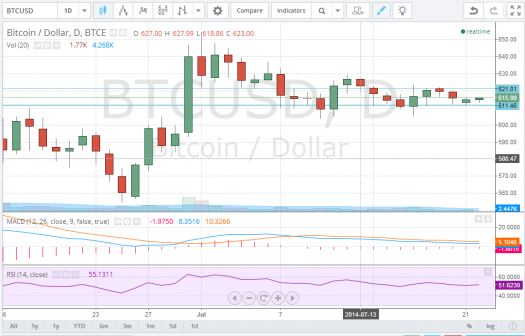
A close look at daily charts of BTC/USD shows that the digital currency is trading in a very narrow range on back of low volumes but has taken strong support at $609 which is also the monthly pivot level for the digital currency. Aggressive traders are watching the aforementioned level as any close below the above level would lead to reversals of many long trades. BTC/USD in yesterday’s trading session touched made an intraday low of $611.5 but saw some buying at lower levels and closed towards the higher point of the day. The momentum indicators for the digital currency are in flat trajectory which confirms the current sideways movement in BTC/USD.
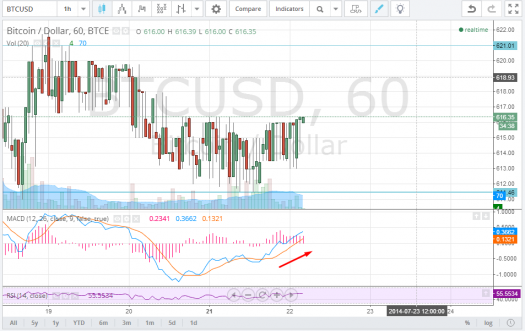
BTC/USD on hourly charts has support at levels of $611.94, but has been
trading in a very narrow trading range, finding it difficult to cross
the resistance levels of $616.94. The MACD for the BTC/USD has provided a
fresh buy signal on low volumes. For long term traders, a an entry
point should be initiated above $617 with a strict stop loss at $611.
Meanwhile, short trades should be initiated once the BTC/USD closes
below $611 with a stop loss set at $617.
The increasing number of businesses accepting the digital currency only
bodes well for the future despite the current narrow trading range and
may provide strong buy opportunity for medium and long term trades.


